


Chart of the Week
Best in Class

So far this year leveraged loans have managed to earn a 3% return – better than other investments, and with…
Read MoreEnergy Loss

Relative to the overall market, secondary trading prices of energy-related issuers have taken a hit in the face of sector…
Read MoreCorrelation Nation

The high yield bond premium over Treasuries and volatility as measured by the VIX have proven to be highly correlated.…
Read MoreBDC Woes

Multiple factors including lower asset yields and slashed dividends have punished trading levels for public BDCs. BDC Price to Net…
Read MoreMidcaps Motor On
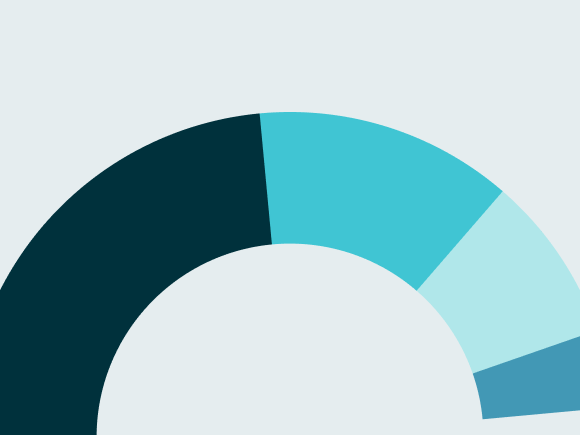
For the first time in at least a decade, purchase price multiples for middle market buyouts have topped the metric…
Read MoreLift Off
One consequence of higher purchase price multiples is more cash equity as a share of buyout capital. Equity contribution for…
Read MoreBuy-outs vs. Cash-outs
Despite their reputation as riskier loans, dividends to sponsors have a 20-year history of lower defaults than the original buyout…
Read MoreJust to Recap

Seller friendly market conditions have spawned a revival of dividend recaps, though volume is still short of the comparable period…
Read MoreLower Gears

While these data include all middle market loans, not just LBOs, the trend seems to confirm regulatory pressures are impacting…
Read MoreYield Signs
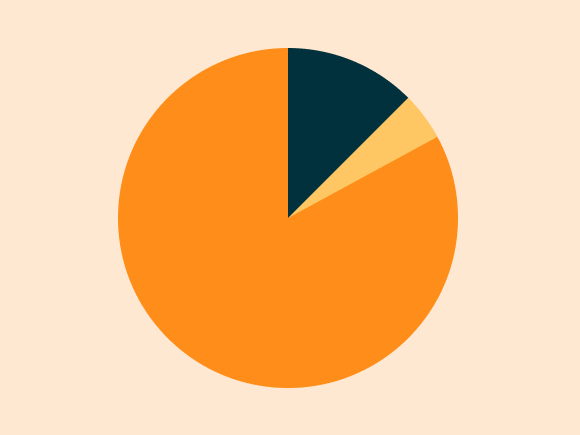
Regulatory pressures have buoyed spreads since early 2014, with middle market at a consistent premium to large caps. Source: Thomson Reuters…
Read More