



Middle market lending failed to impress in 2015 as both the sponsored and non-sponsored markets were down roughly 30% year-over-year. In the non-sponsored market, volatility spooked issuers in the second half of the year causing many to hold off on M&A and expansion plans. Furthermore, there was no incentive to refinance because issuers already locked in favorable rates and long tenors in earlier years. 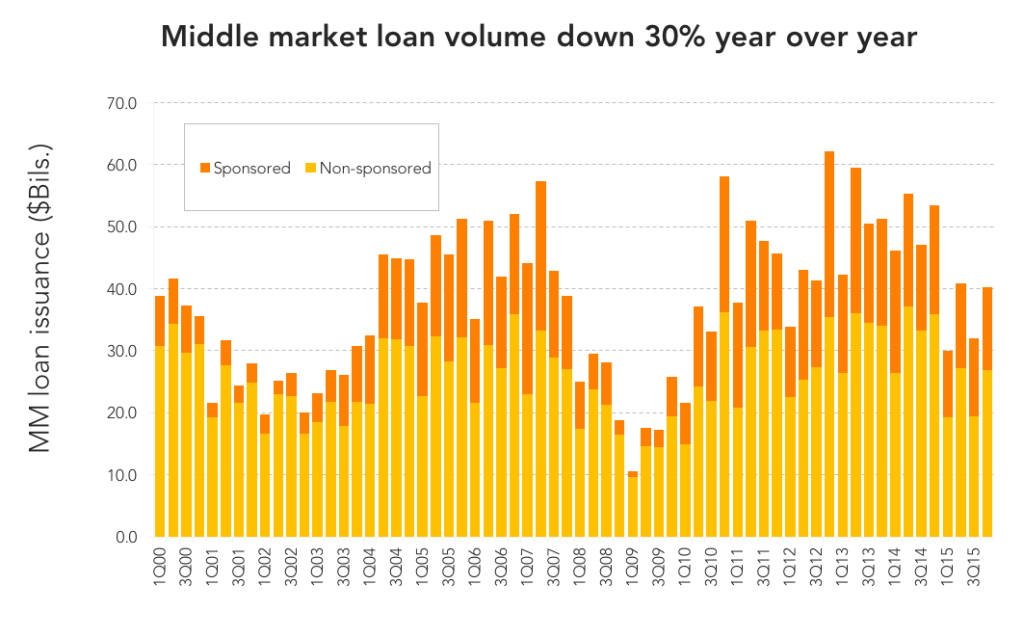 Plummeting oil prices also stymied oil and gas lending which is typically a strong industry for loan volume for many regional banks. Banks were further constrained by regulatory pressures such as Leveraged Lending Guidance and Liquidity Coverage Ratio – causing many to step back from risky lending or lending to issuers at uneconomical pricing. Sponsored loan volume also underwhelmed lenders. Issuance reached US$50bn in 2015, down 28% year over year. Volatility and lofty yields resulted in less refinancing and dividend recap activity. But even M&A struggled as valuation multiples hit record levels while economic growth showed signs of slowing down – making superior returns harder to achieve. Middle market LBO volume reached US$18.9bn in 2015, down 9% year over year and 36% lower than the peak levels tracked in 2007.
Contact: Fran Beyers
frances.beyers@thomsonreuters.com





Latest news


Software, consumer-related direct lending deals fell in H1'26
The software and technology sector, the second-most-active sector in 2025 at 17% of total deal activity, slid to fifth place in the first half of 2026.

Unconquered Territory
With most of the map still unexplored, there’s room for a sequel.