



Download PitchBook’s Report here.
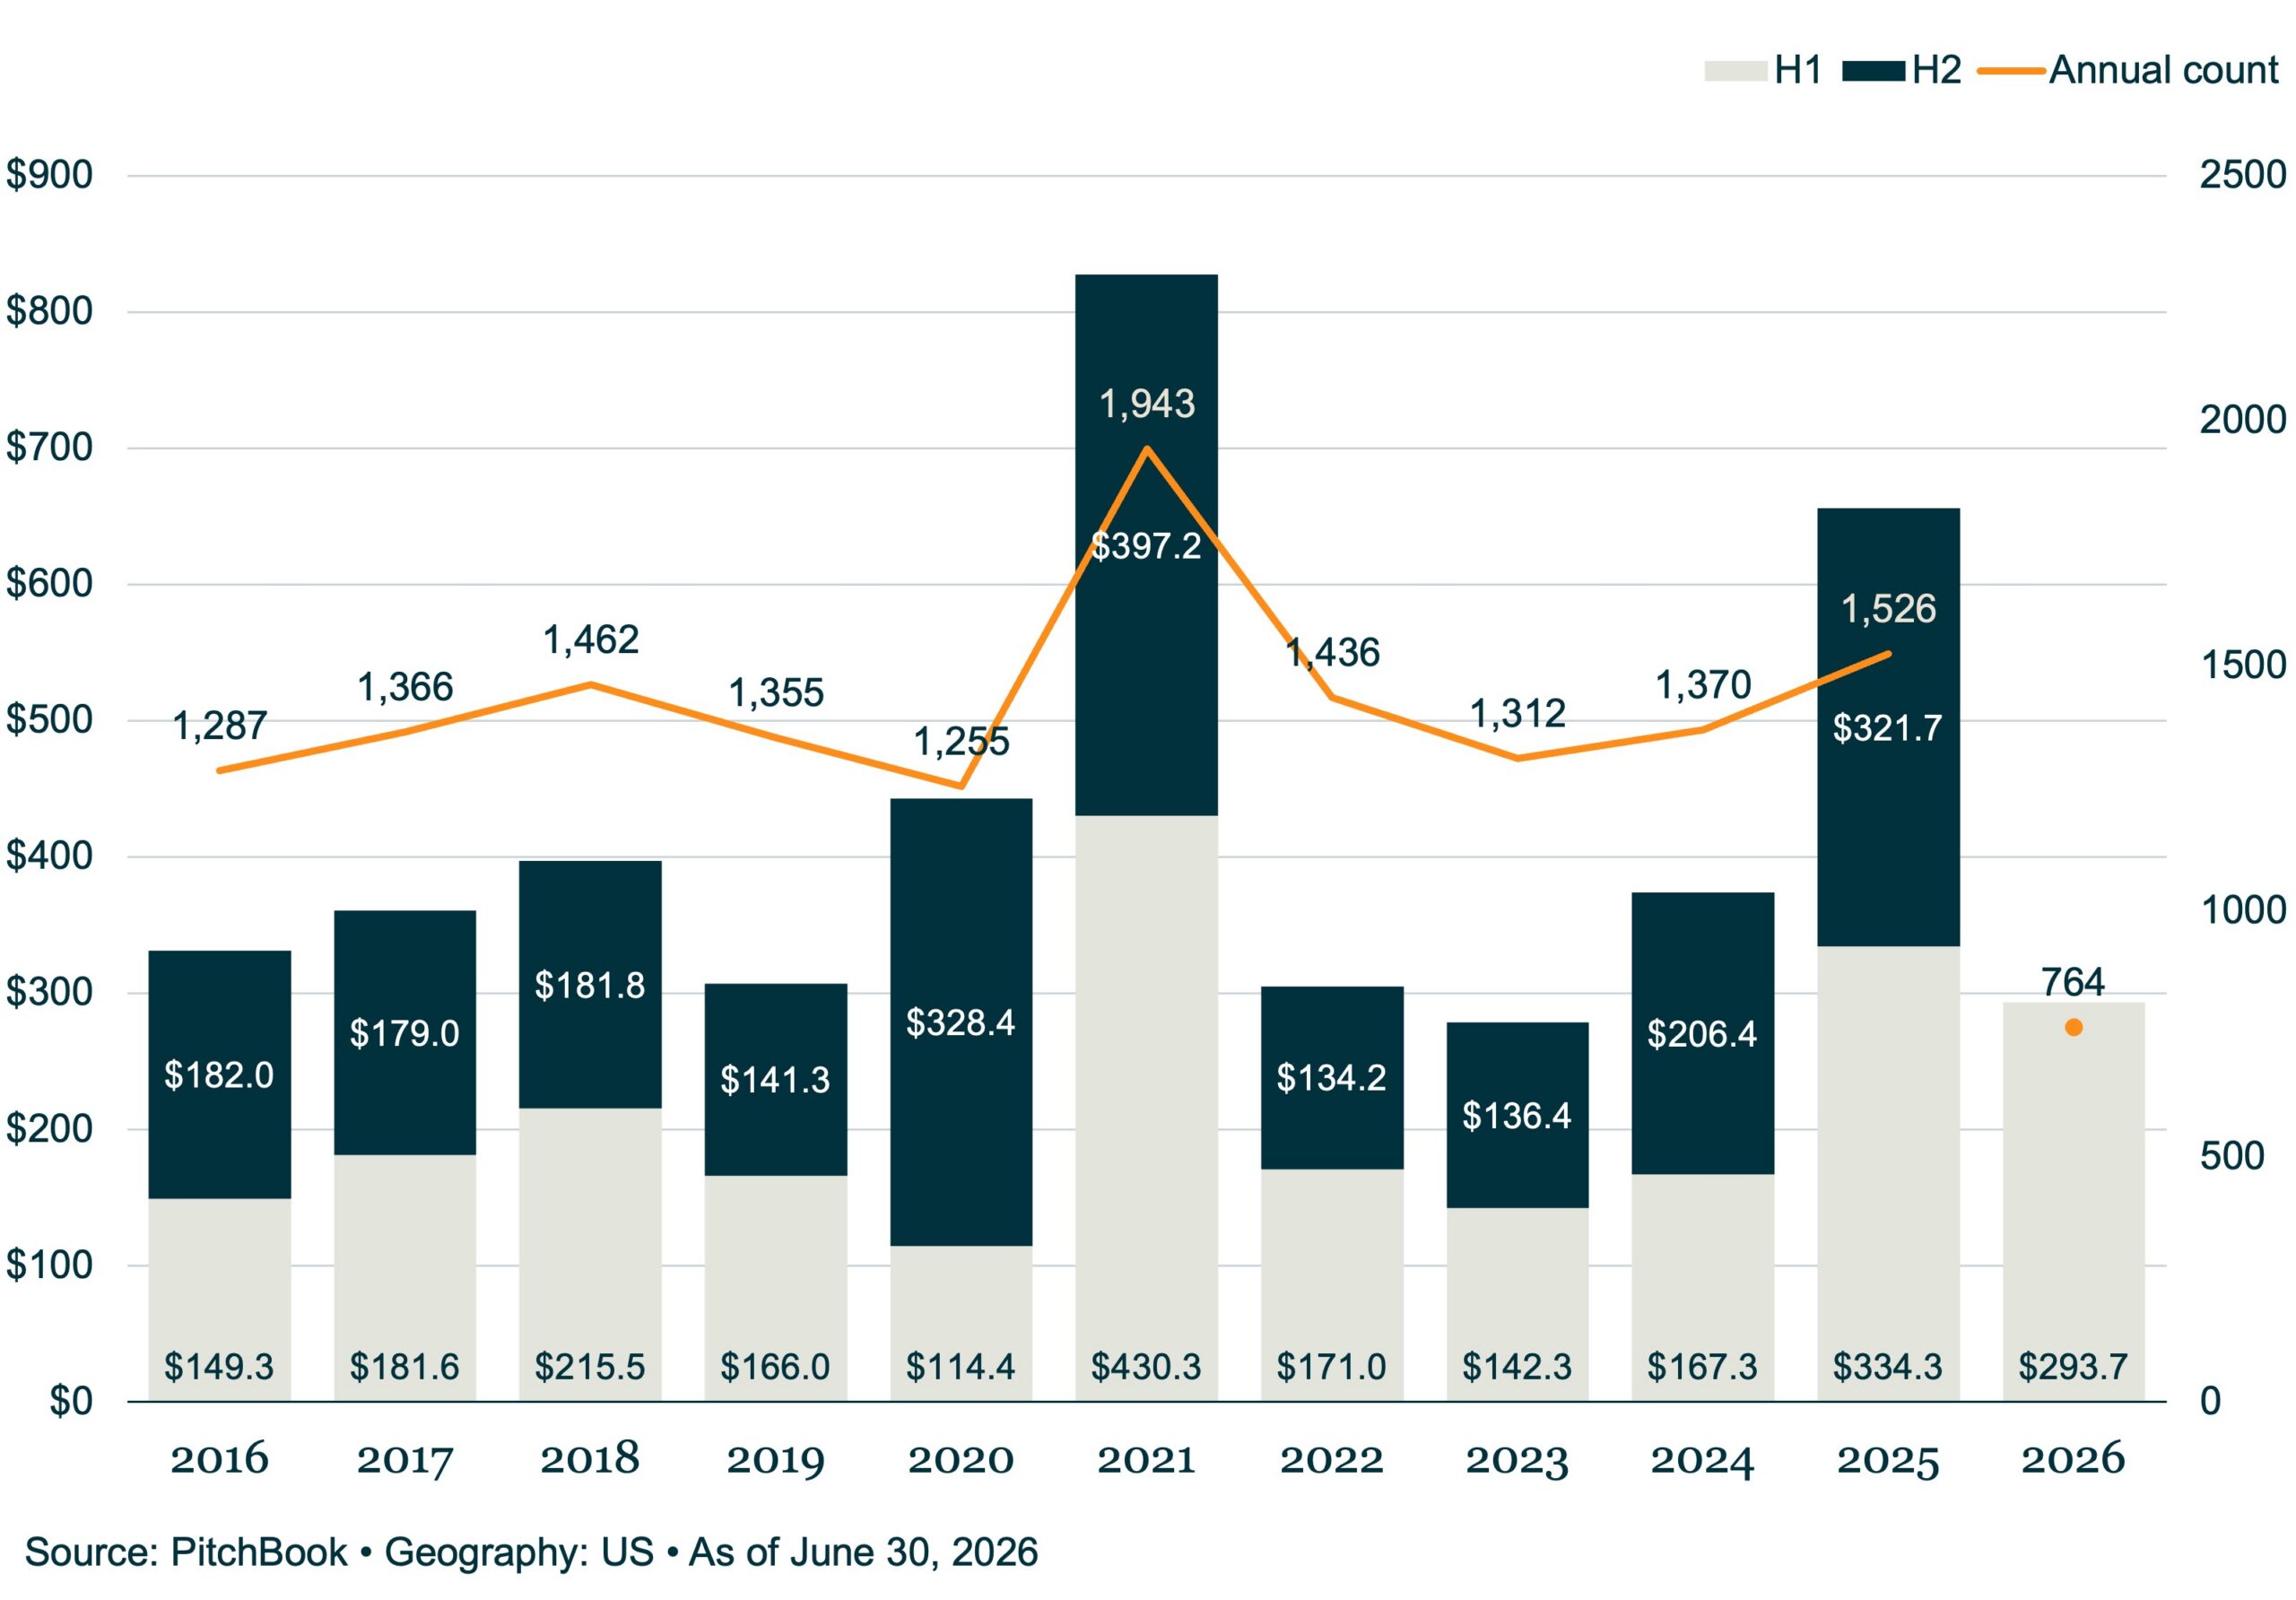
Exit value fell to $102.6 billion in the second quarter—down 46.3% from the prior quarter and 7.4% YoY—while exit count dropped to 353, a 14.1% quarterly decline and a 5.4% rise against Q2 2025. The figures include estimates for latereporting transactions. The same macro forces depressing dealmaking, such as costlier financing, an uncertain rate path, and software repricing, are at work here, with the added drag of an already constrained exit landscape. On a YTD basis, the contraction is shallower than the quarterly figures imply, with the H1 2026 exit value of $293.7 billion down roughly 12% against the comparable 2025 window. This is a reminder that a stronger first quarter cushioned an otherwise difficult first half of the year. Q2 exit activity is comparable to the dip in 2025, and exit value sits above pre-pandemic averages, but realizations remain stubbornly dependent on a small number of large transactions to generate aggregate value. Mega-exits, those of $1 billion or more, totaled $63.2 billion across 23 transactions, anchoring more than 61% of the total exit value in Q2. This demonstrates that premium assets can still clear at scale, but it underscores how little of the broader portfolio backlog is finding a path to liquidity.





Latest news

US BSL and MM CLO Performance Held Stable in July 2026
In July 2026, portfolio credit quality in reinvesting Fitch-rated U.S. BSL CLOs remained broadly stable from June. Net portfolio losses held at 0.5%. The Fitch weighted average rating factor also held at 23.1. The Fitch weighted average recovery rate declined slightly by 0.1%, while the weighted average spread fell by 0.01%.


Middle market debt held by BDCs vs High yield vs Treasury yields
The blue line is the dividend yield of the VanEck BDC Income ETF (BIZD), currently at 11.4% as of 14…