



After a busy first half of the year, CLO issuance has been relatively muted in the 3rd quarter, recording $15.5 billion of new CLO paper so far, that is, half the volume recorded in each of the first 2 quarters of the year. Year-to-date volume stands at $76 billion, down from the $94 billion recorded at the end of September 2014. CLO formation has drawn back even as the leveraged institutional market has become more dependent on it. 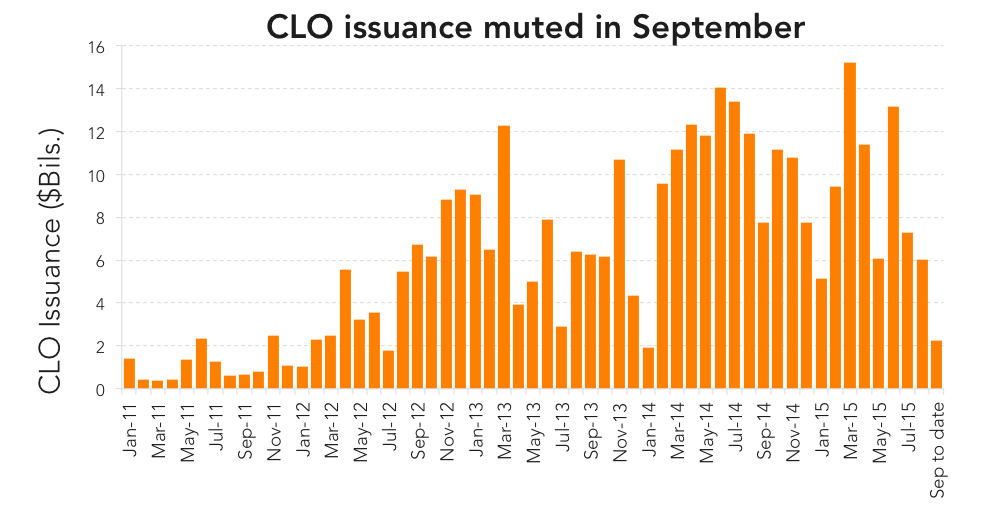 Participants report several challenges, including placing CLO equity and the availability of loan collateral. With leveraged M&A issuance down 10% year over year, deal-making has proved especially difficult in the leveraged space, even as sponsors are flush with cash, they report valuations are too high. Combined with Leveraged Lending Guidelines that aim to dampen excessive risk-taking, loan collateral is more expensive to source, eating into arbitrage. Aside from these challenges, there are enough warehouse facilities in place to expect a pick-up of activity in the last quarter. To wit, Well Fargo recently increased its annual forecast for CLO issuance to $105 billion, from $75 billion, not the record haul from last year but a respectable showing for a market in transition.
Contact: Hugo Pereira
hugo.pereira@thomsonreuters.com





Latest news


Software, consumer-related direct lending deals fell in H1'26
The software and technology sector, the second-most-active sector in 2025 at 17% of total deal activity, slid to fifth place in the first half of 2026.

Unconquered Territory
With most of the map still unexplored, there’s room for a sequel.