


Deals with nonbacked companies as targets as a share of all PE buyouts by quarter


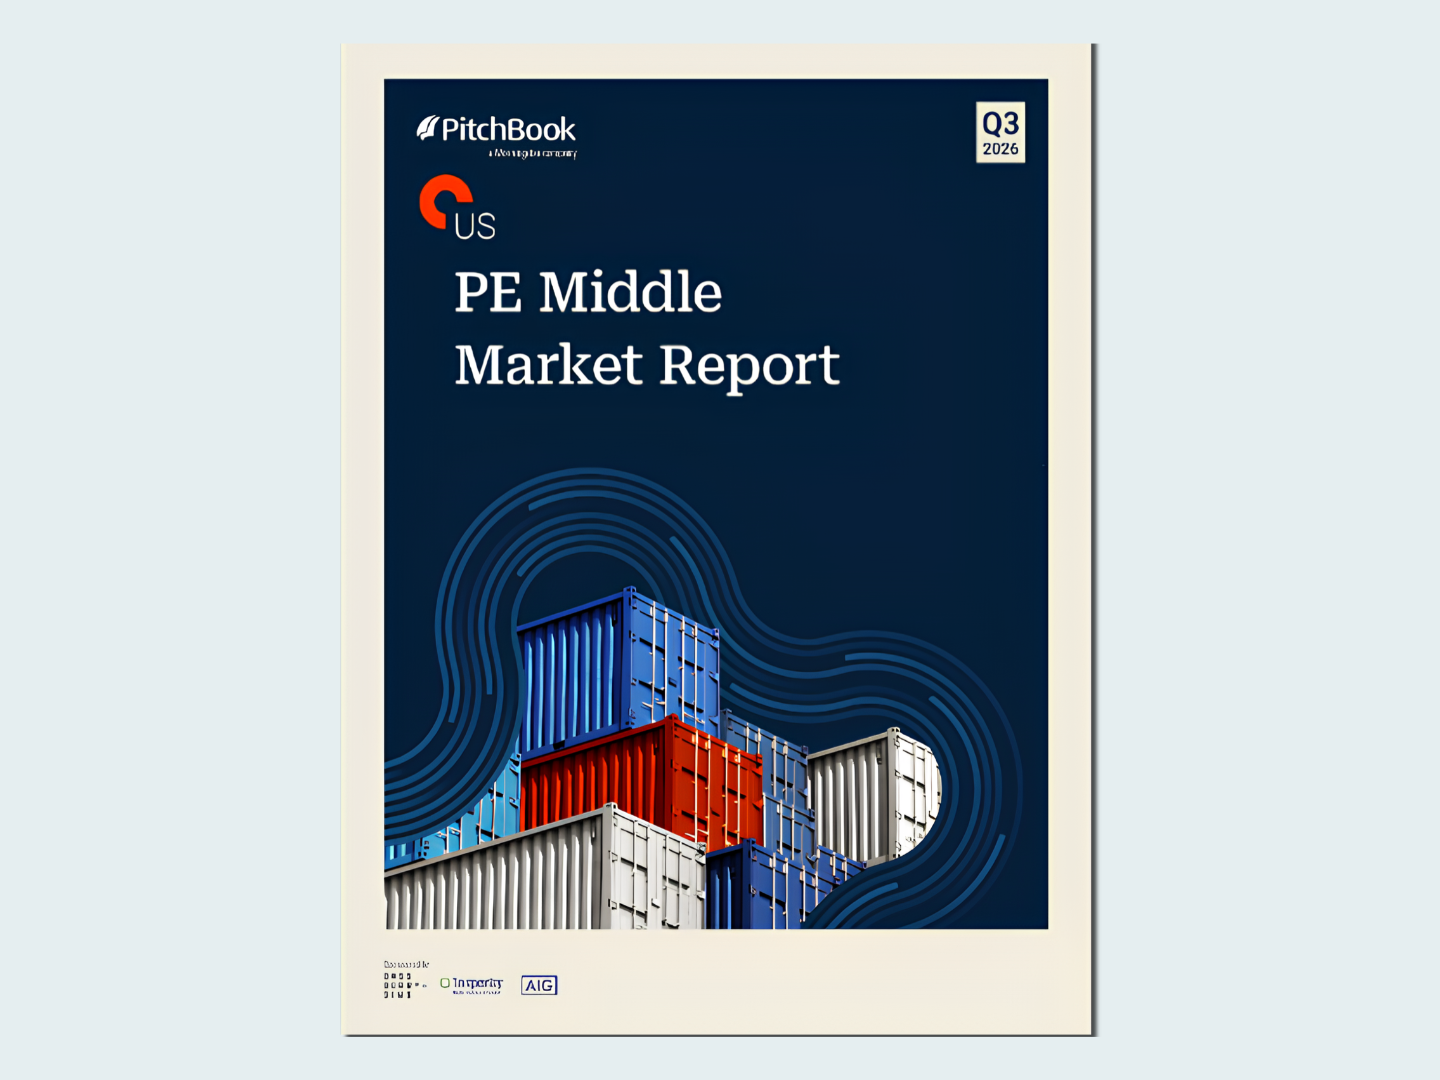
Download PitchBook’s Report here.
Borrowing costs remain elevated and will likely stay that way for the remainder of 2024. As a result, PE firms continue to look further down market at companies with lower, more favorable purchase prices to compensate for the lack of leverage. When looking further down market, the number-one seller that sponsors have found is nonbacked companies, also known as founder-owned businesses, that have never accepted outside capital. Additionally, US PE firms continue to sit on elevated levels of dry powder, which currently totals $965.0 billion and needs to be put to work in a limited universe of sellers. As a result, we expect nonbacked businesses to continue to take up a growing percentage of all US PE deal activity.
(Past performance is no guarantee of future results.)
Latest news
Software, technology and consumer sectors lose deal share in 9M’26
The software and technology sector, the second most active sector in 2025 at 17% of total deal activity, slid to fifth place in the first nine months of 2026.


Leveraged loan investors see gains in November
Following a 0.25% decline in October, the Bloomberg US Leveraged Loan Index (Ticker: LOAN) has returned 0.60% this month through…