



Download PitchBook’s Report here.
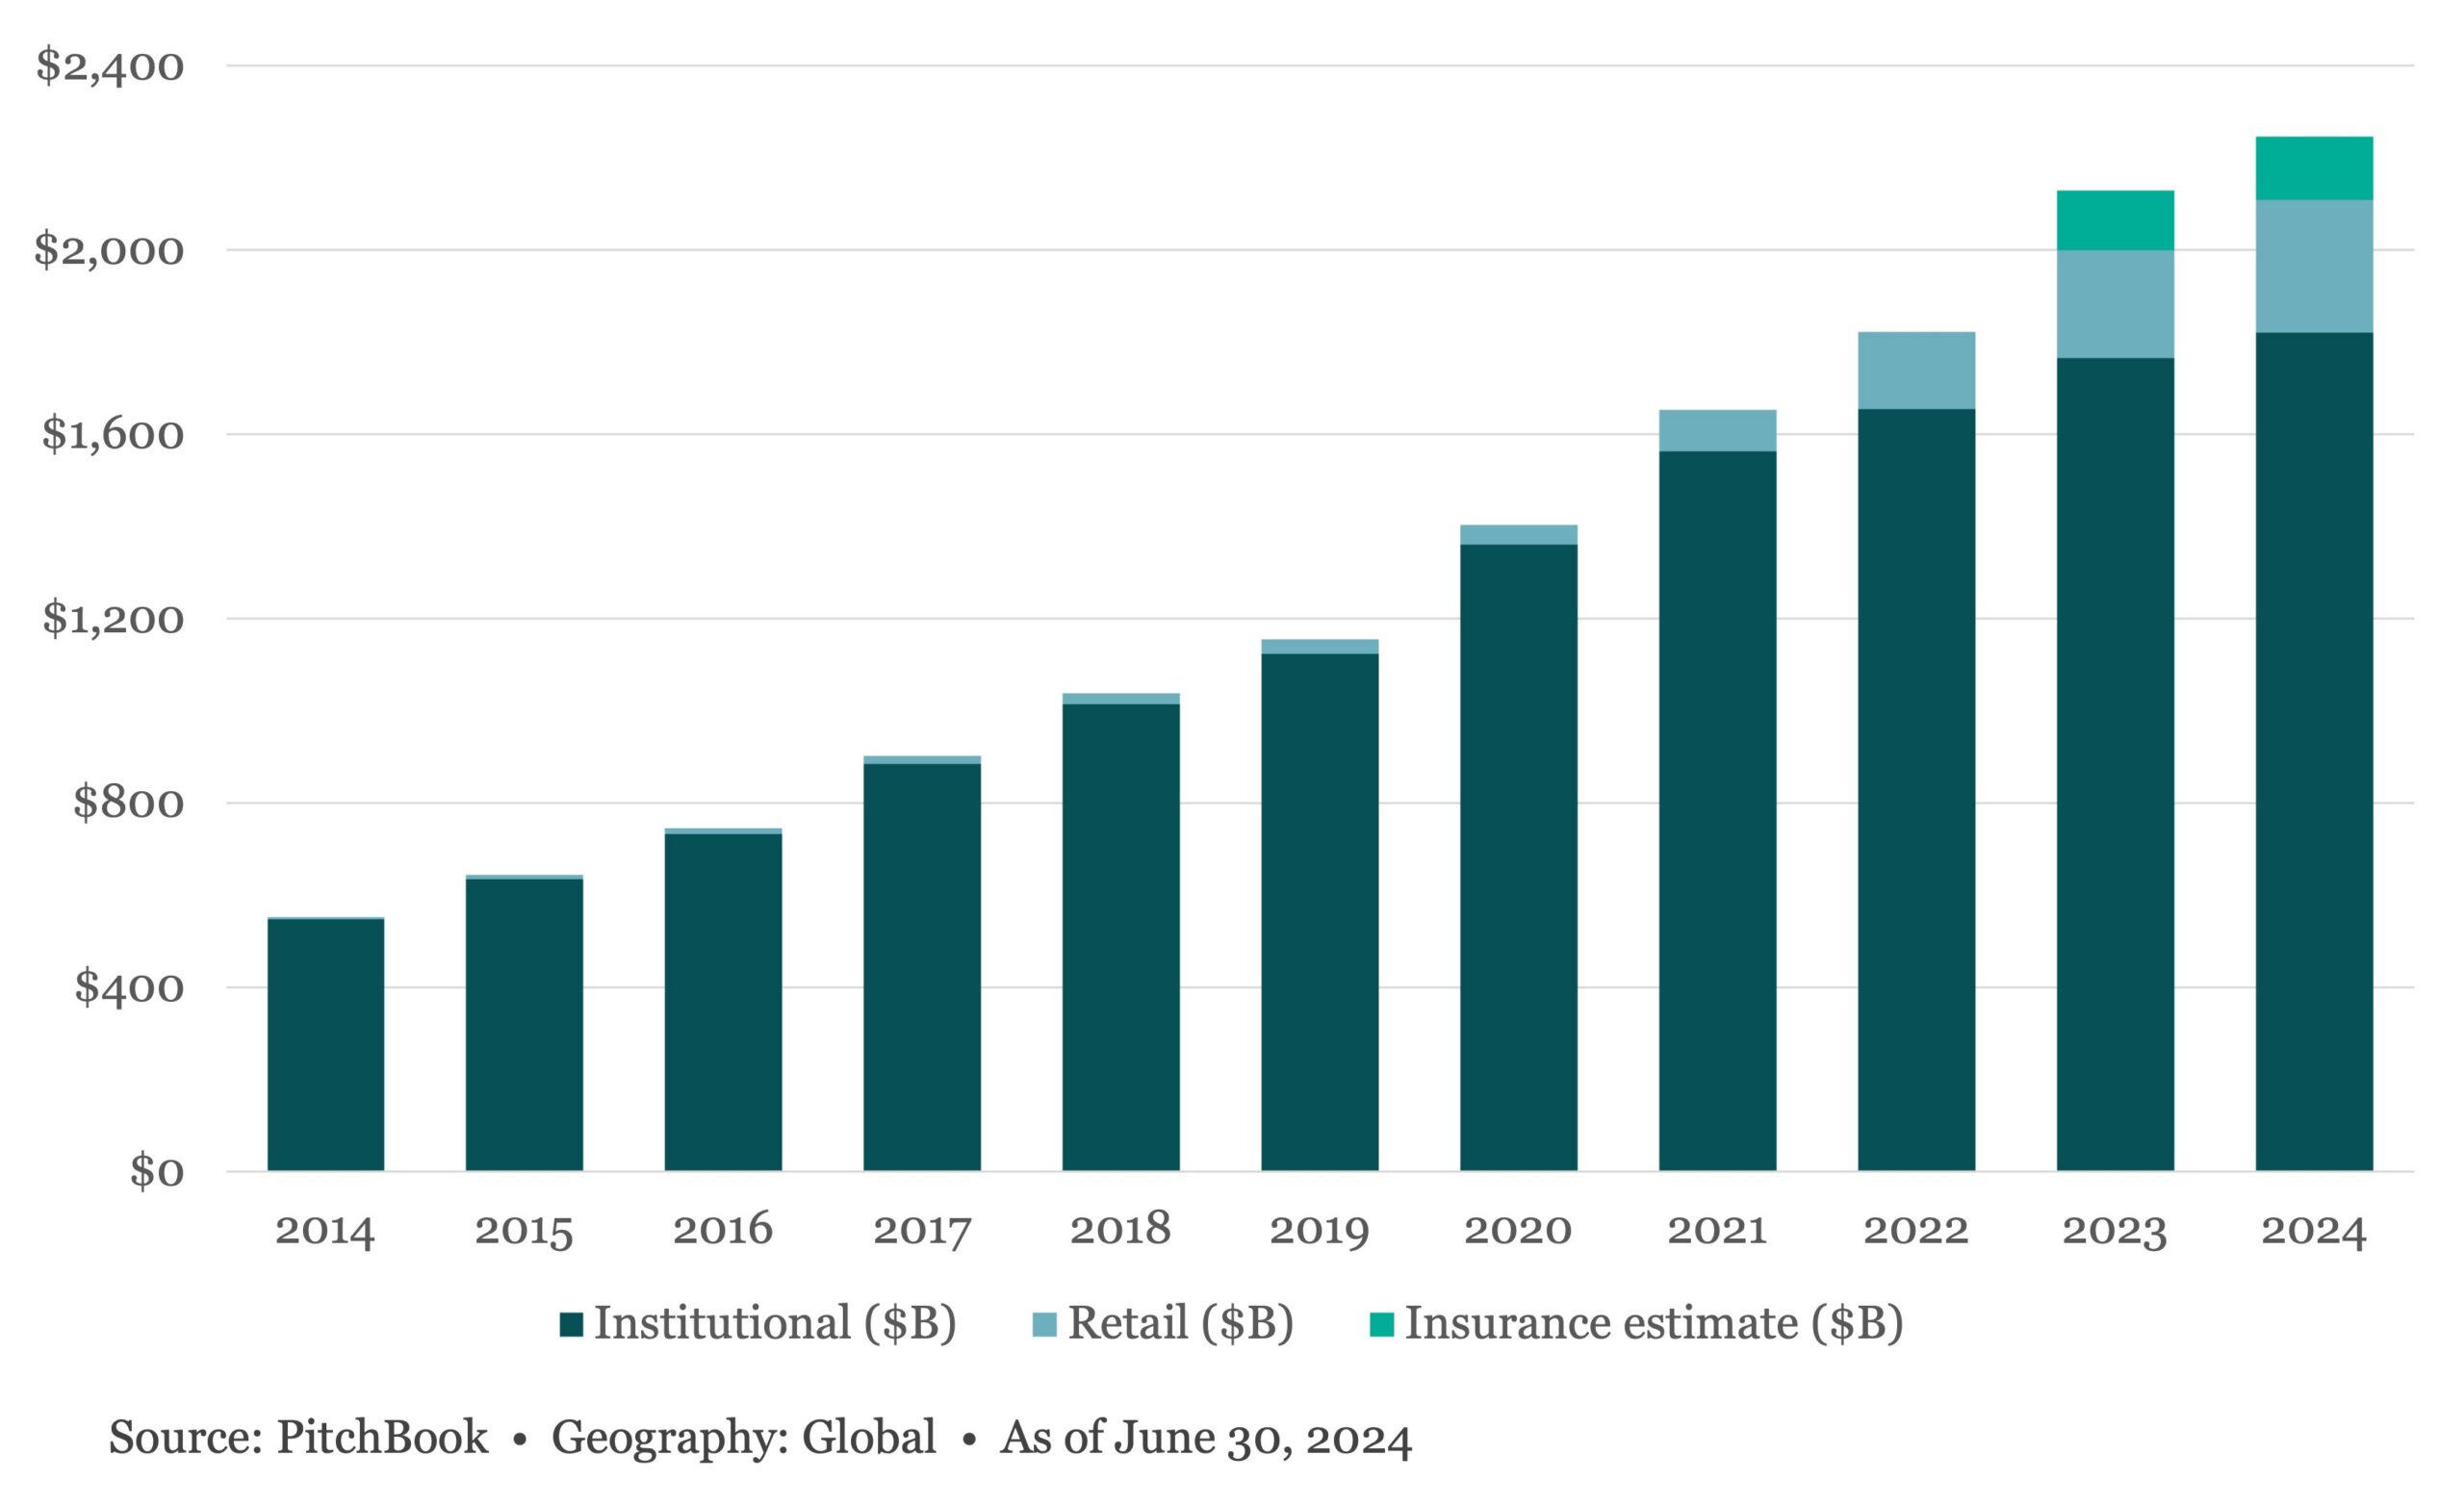
Since 2019, PitchBook has tracked 207 private market fund launches across these three vehicle types, all targeting the private wealth channel; the total net assets in these vehicles were $274.8 billion as of July 31, 2024. Moreover, nontraded BDCs continued to FUNDRAISING AND DRY POWDER command significant capital and remained the top-selling category among alternative investments in 2024 in the retail channel, eclipsing nontraded REITs for two years running. While private credit does not account for 100% of AUM in these products, they are a standout. Non-listed BDC AUM is unsurprisingly the exception, consisting of only private credit capital, while interval and tender offer funds span multiple asset classes. According to the report, private credit accounts for nearly 75% of all interval fund AUM.
(Past performance is no guarantee of future results.)



Latest news

US Leveraged Loans Return 3.36% to Investors YTD
The Bloomberg US Leveraged Loan Index (Ticker: LOAN) returned 0.96% in August and has gained an additional 0.28% through September…

PE dry powder
The capital that is being raised is flowing overwhelmingly to the largest, most established managers.

Middle market debt held by BDCs vs High yield vs Treasury yields
The blue line represents the current dividend yield of the VanEck BDC Income ETF (BIZD), which stood at 11.7% as…