



Download PitchBook’s Report here.
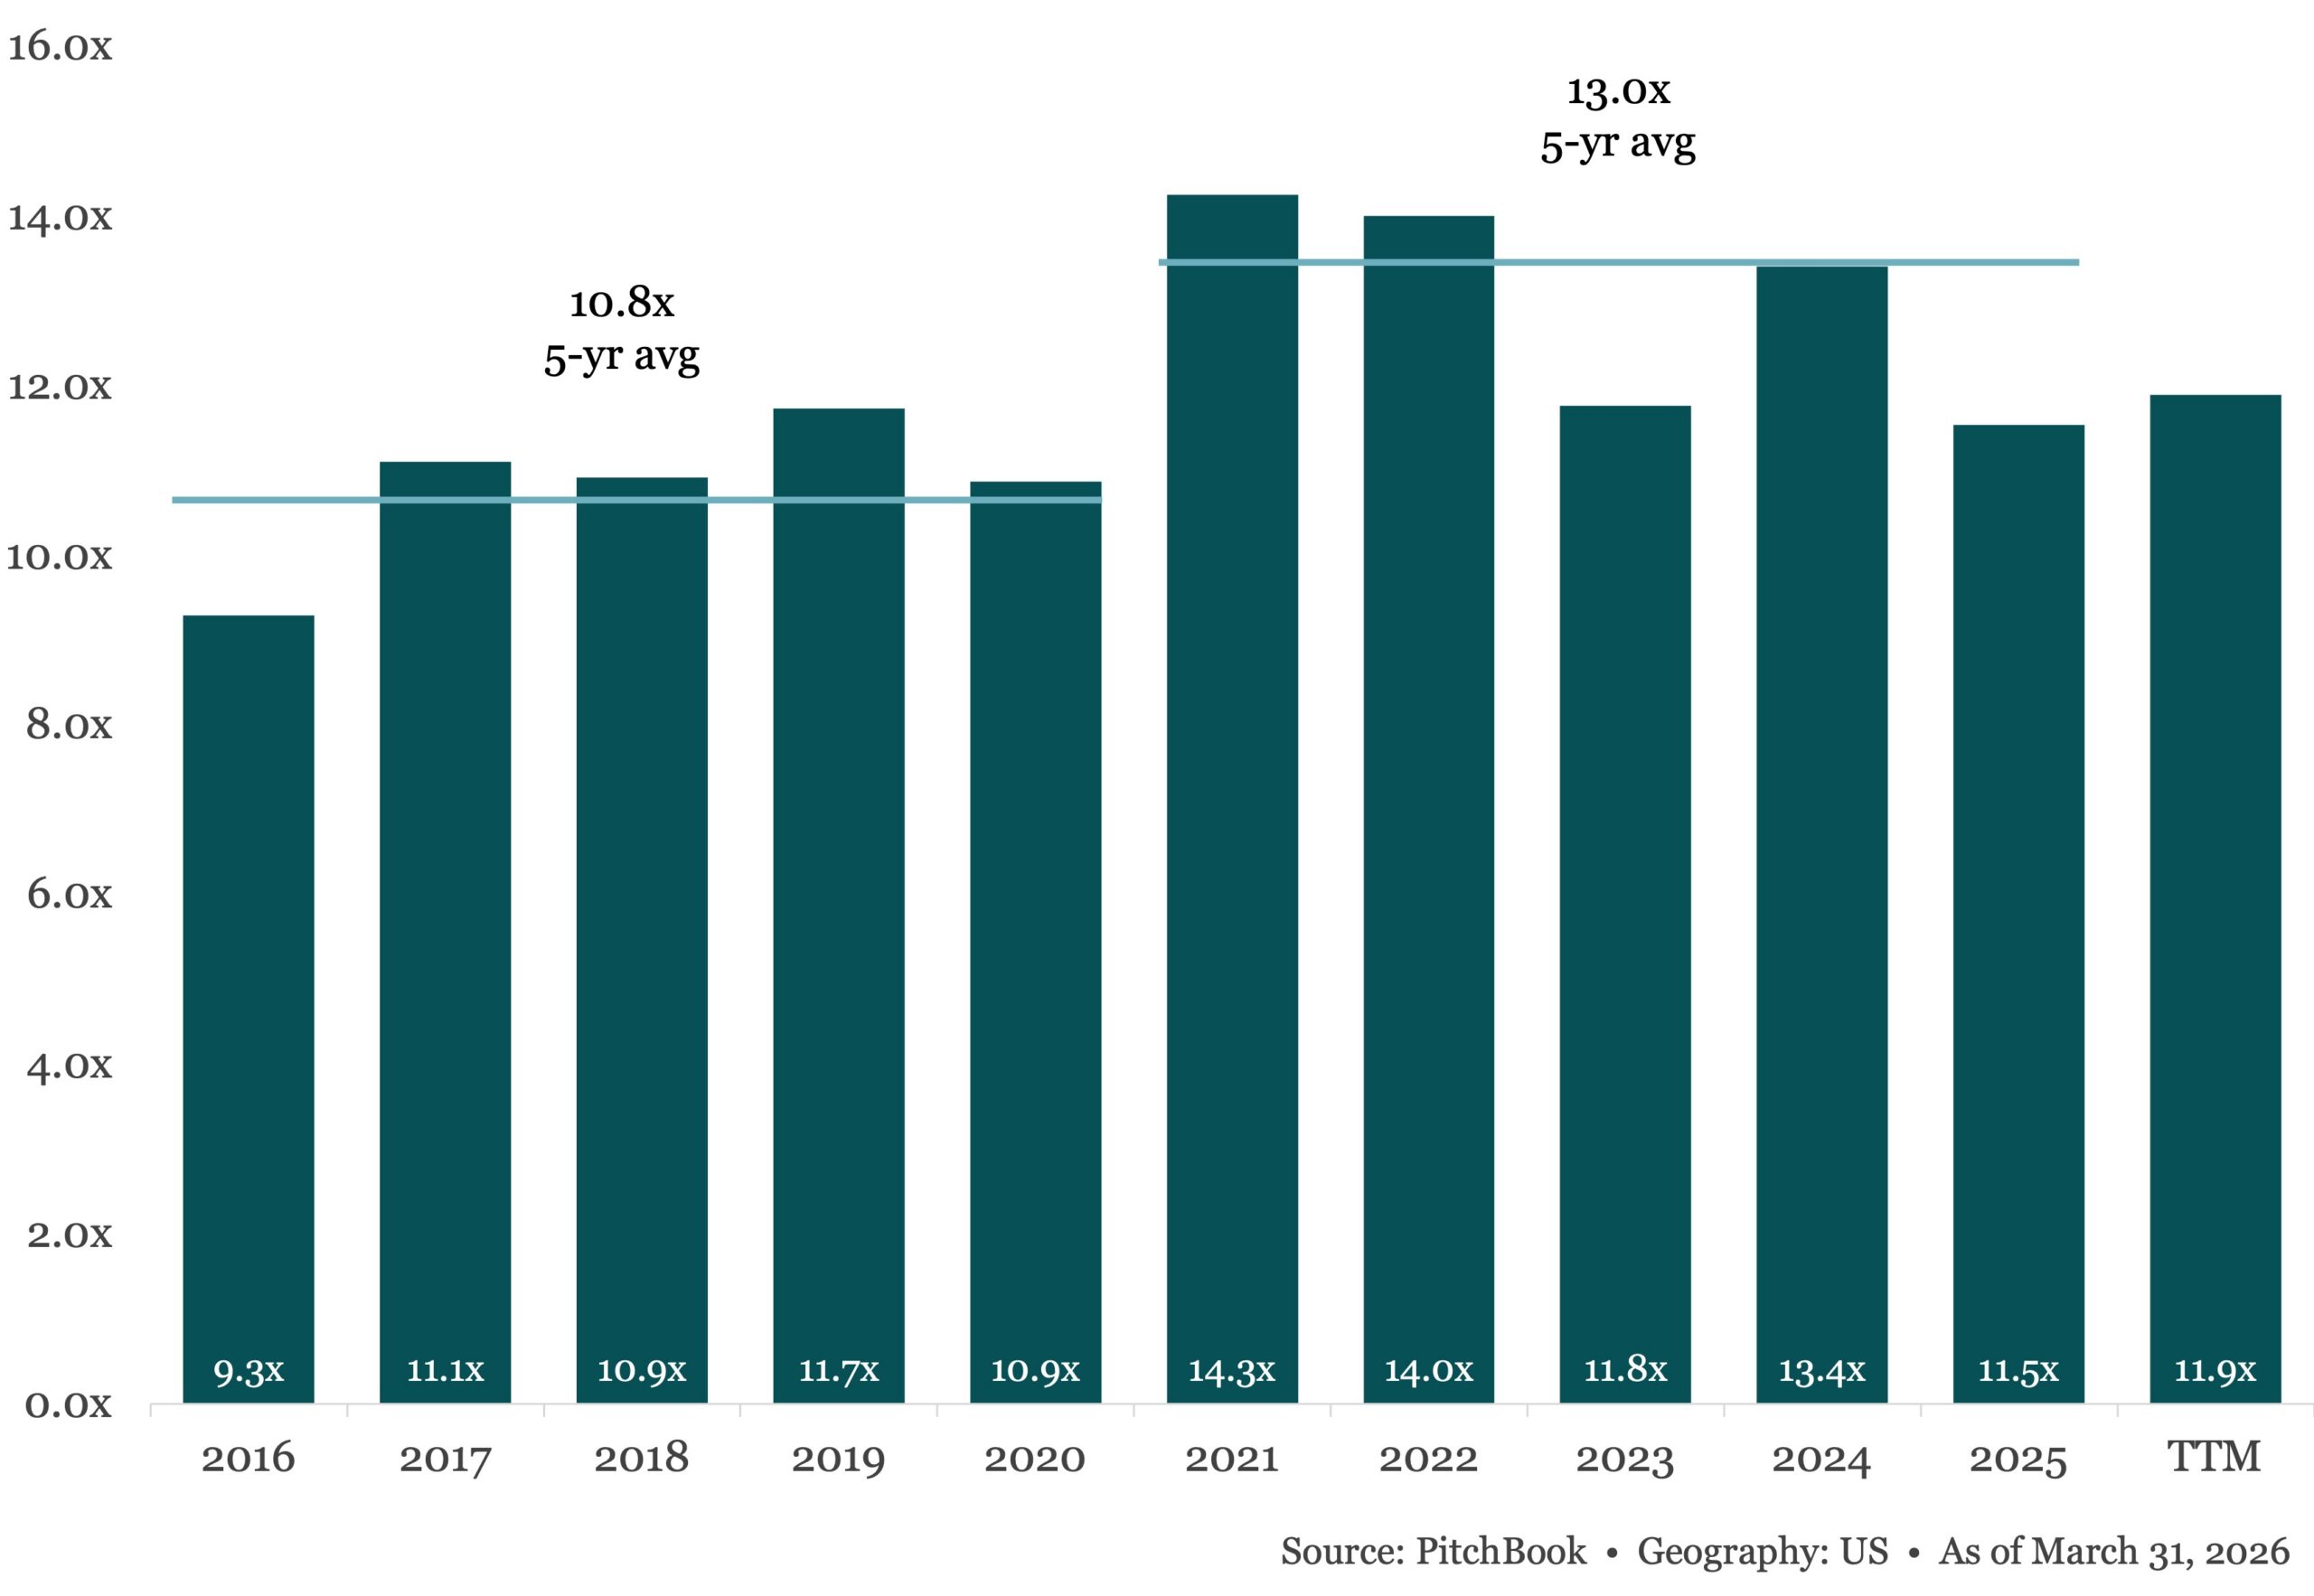
Global buyout valuations have held steady through the opening months of 2026, with TTM EV/EBITDA multiples hovering near the levels seen during 2024’s recovery and 2025’s subsequent plateau. However, that stability warrants closer scrutiny. Rather than reflecting current pricing, flat multiples may be more a function of reduced transaction activity in the second half of the quarter as the bid-ask spread re-widened amid heightened macroeconomic and policy uncertainty. Sponsors, increasingly armed with liquidity solutions such as continuation vehicles, have demonstrated a willingness to hold assets through volatility rather than transact at lower multiples. The result is a market where headline valuations look resilient, but the underlying signal is muddled by a thinner deal set skewed toward higher-quality assets.
(Past performance is no guarantee of future results.)



Latest news

US Leveraged Loans Return 3.36% to Investors YTD
The Bloomberg US Leveraged Loan Index (Ticker: LOAN) returned 0.96% in August and has gained an additional 0.28% through September…

PE dry powder
The capital that is being raised is flowing overwhelmingly to the largest, most established managers.

Middle market debt held by BDCs vs High yield vs Treasury yields
The blue line represents the current dividend yield of the VanEck BDC Income ETF (BIZD), which stood at 11.7% as…