



Download PitchBook’s Report here.
The US middle market went gangbusters last year, setting records in both volume and dollars. Two of the three segments of the middle market, however, inched down YoY. Not by much—the upper middle market ($500m-$1b) fell by 5% in volume and 7% in value, while the lower middle market ($25m-$100m) missed 2017 volume by three deals (902 vs. 905) while shedding 7% in total value. Flat years, in other words, but still strong in the grand scheme of things.
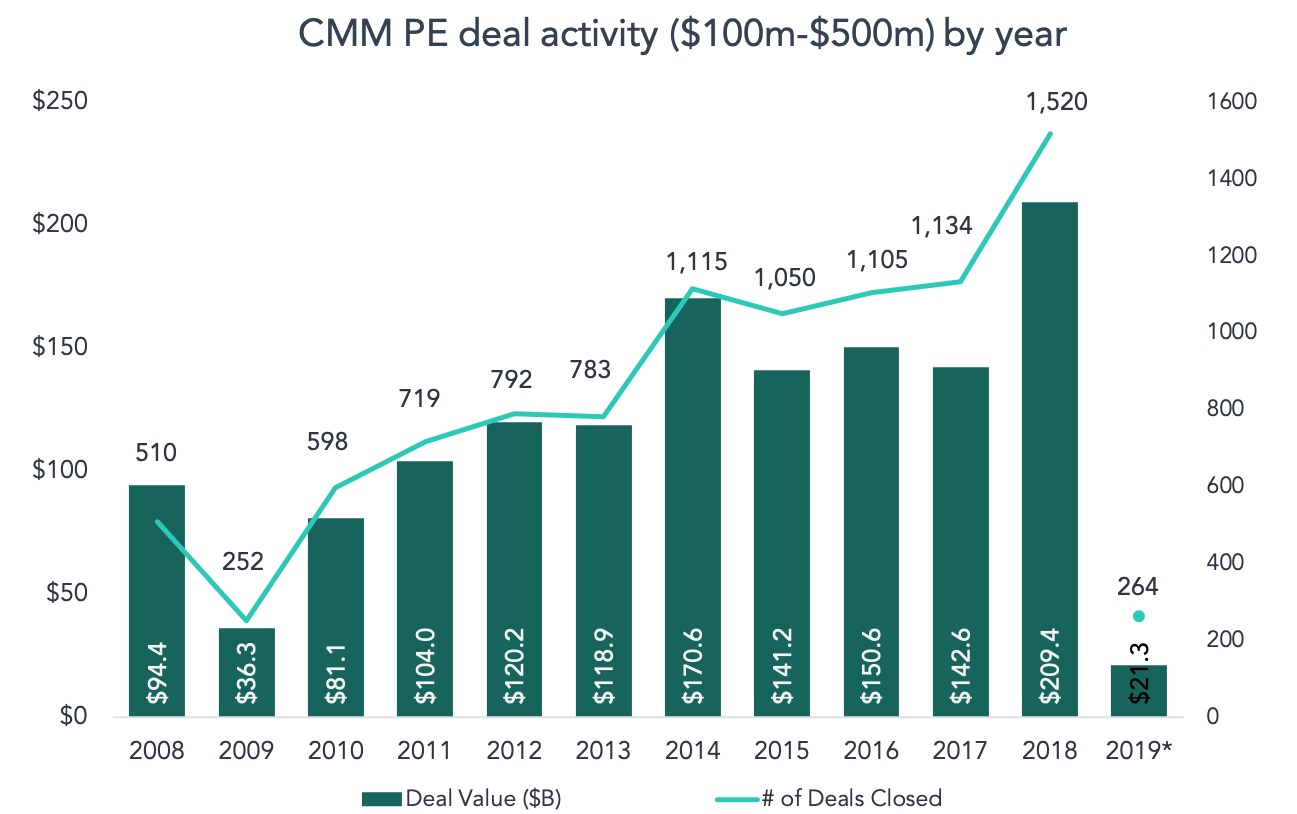
Then there’s the “core” middle market, the goldilocks range of $100m-$500m. The CMM typically sees three times the volume that the upper end does, but deal counts at the lower end have, until a few years ago, been roughly comparable. In fact, prior to 2013, the LMM tended to outpace the CMM in deal counts, a trend that now seems permanently reversed. The chart above shows a gradual increase in volume in the aftermath of the crisis. Volume then jumped by 42% in 2014, eclipsing 1,000 deals annually for the first time.
It turned out to not be an anomaly, and suddenly 1,000 deals per year was the new normal. Last year was a reprise of 2014, with volume vaulting another 34% out of the blue. A large percentage of last year’s spike was done in Q1, which saw the highest quarterly total (470 deals) in history. One potential variable was the Tax Cuts and Jobs Act, which included the big reduction in the corporate tax rate—which applies to PE portfolio companies and the funds that control them—that was signed into law in December 2017. Every quarter last year saw at least 300 CMM deals close, a threshold that was hit only twice before the legislation was introduced. It’s an incomplete explanation, though, considering the same trend wasn’t mirrored elsewhere in the middle market. On the other hand, both the LMM and UMM hit quarterly volume records at some point last year—Q2 was a record in the LMM and Q3 was a record in the UMM. Whatever the case, every corner of the middle market had somewhere to hang their hats last year. Time will tell if we’re looking at a new new normal, or a temporary, tax-induced sugar high.





Latest news

Rate hike expectations ease as term SOFR curve flattens
The CME six-month Term SOFR rate reached a recent high of 3.979% on July 28 before retreating to 3.837% as…
3Q26: New loan assets rise to 44% of total lending, a 3-year high
New loan assets as a proportion of total US loan volume make up 44% of the 3Q26 pipeline to date,…

North American GPs dominant as fundraising accelerates
Our PEI Private Credit 200 ranking also shows capital raising increasing overall – and accelerating especially fast for the largest…