



Download PitchBook’s Report here.
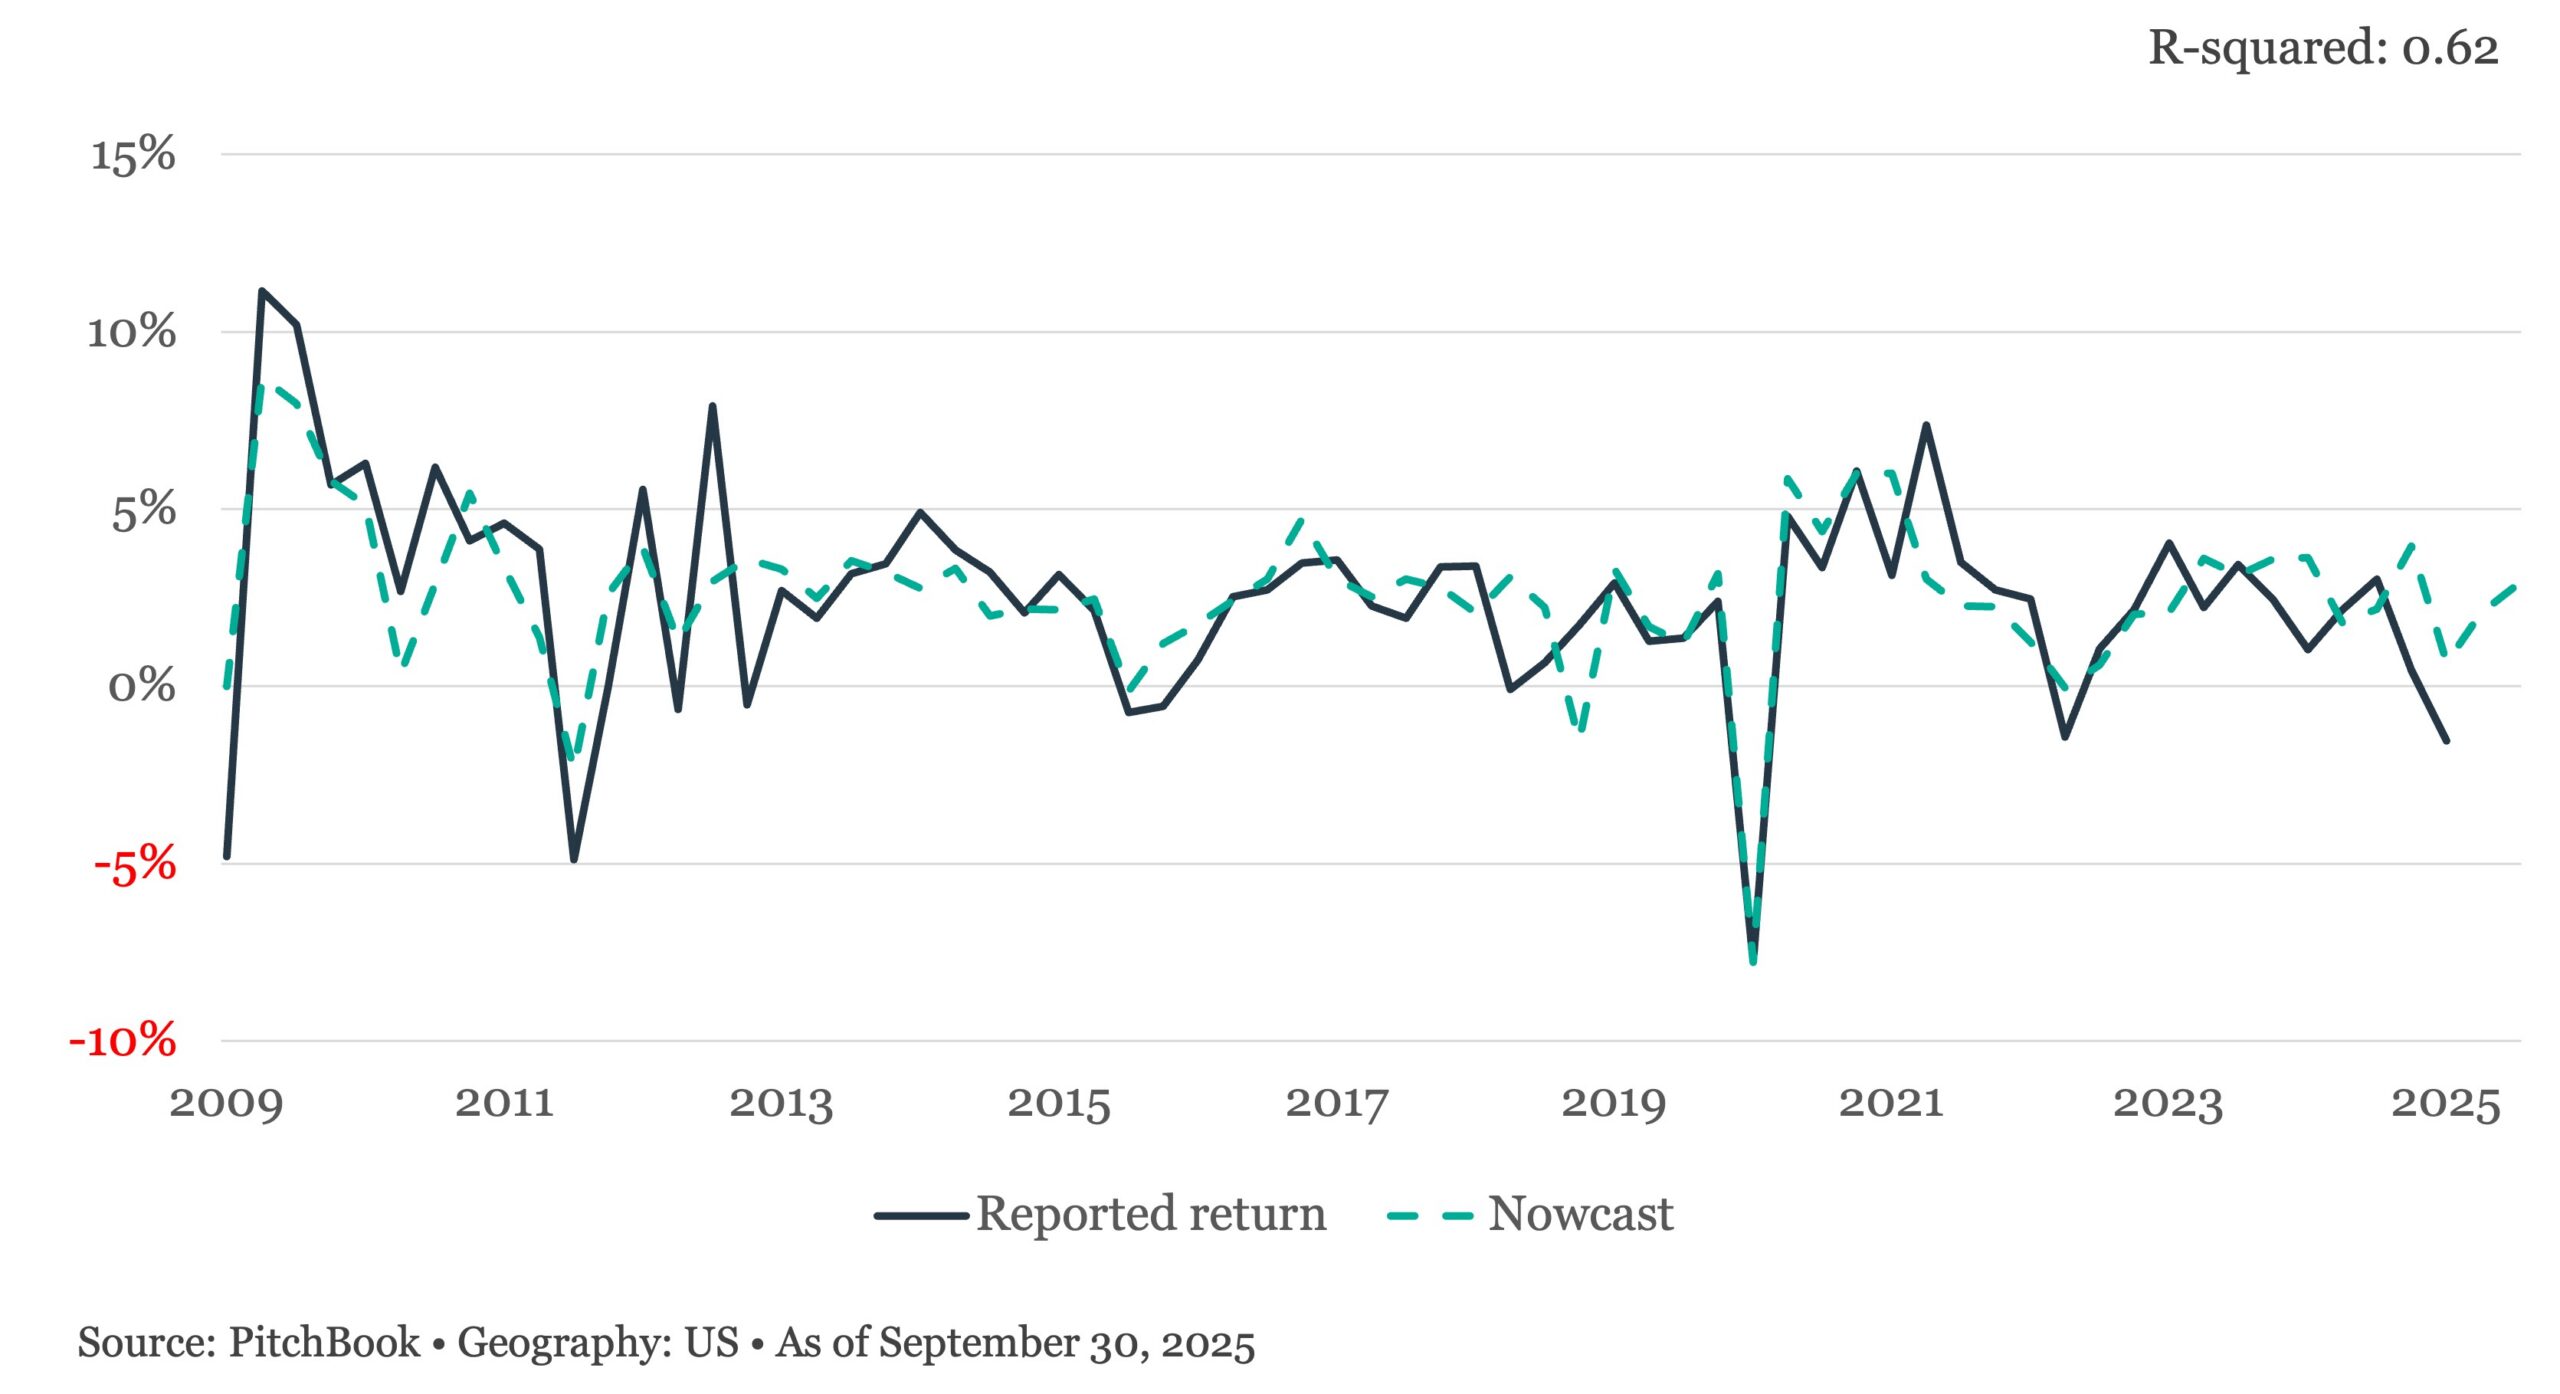
The Private Debt Barometer remains stable and near neutral with a score of 54, producing a nowcast of 2.8% and a desmoothed nowcast of 2.9% for Q3 2025. The score reflects solid performance across public equity and credit markets and easing market volatility, partially offset by tightening lending standards and a modest increase in the Financial Stress Index. Barometer-implied returns indicate that relatively strong performance may persist through Q2 and Q3 2025 as finalized results are reported. However, as of the end of Q3, the environment for floating-rate instruments has potentially become less favorable. Expectations for declining base rates, coupled with tight credit spreads, suggest limited upside, both from falling income on the floating-rate component and minimal potential for price appreciation.
(Past performance is no guarantee of future results.)



Latest news

US Leveraged Loans Return 3.36% to Investors YTD
The Bloomberg US Leveraged Loan Index (Ticker: LOAN) returned 0.96% in August and has gained an additional 0.28% through September…

PE dry powder
The capital that is being raised is flowing overwhelmingly to the largest, most established managers.

Middle market debt held by BDCs vs High yield vs Treasury yields
The blue line represents the current dividend yield of the VanEck BDC Income ETF (BIZD), which stood at 11.7% as…