



View PitchBook’s 2017 Analyst Note: Where can PE firms find attractive valuations? Here
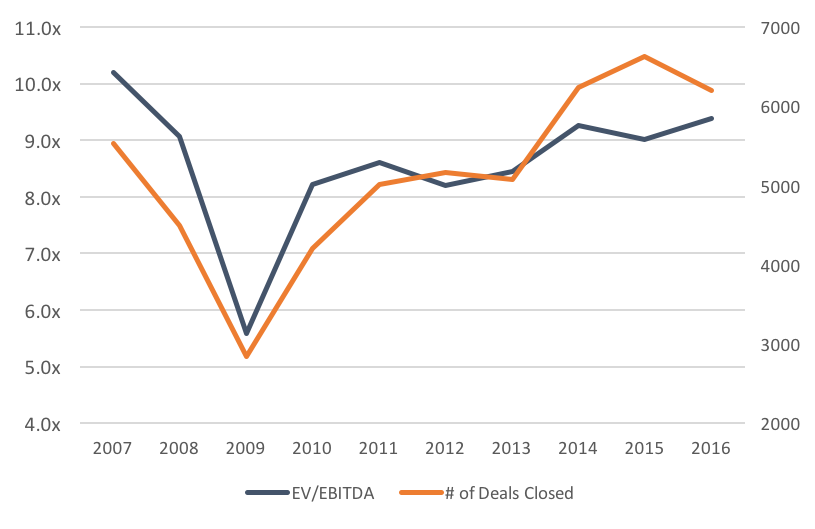
Global buyout activity has gradually surpassed median EBITDA levels following the financial crisis. Creeping up to 10.2x on the eve of the crisis, LBO valuations have oscillated in the 8x-9x range dating back to 2010, a heartening trend for regulators. As usual, though, the headline numbers tell a slightly different story than do the details. In this case, the rise of smaller buyouts and particularly add-on deals helped compress median EBITDA levels across all size buckets while inflating the deal totals. As we’ve mentioned in the past, the “buy and build” strategy of adding on to platforms began in earnest in 2013, a trend neatly reflected in the orange line below. Once the EBITDA levels are broken out by buyout size, the difference becomes all the more transparent: the median multiple for sub-$25M buyouts, which includes many add-ons, is less than half (5.6x) the median valuation commanded for $2.5B+ buyouts (12.3x) over the same timespan. In fact, median EBITDA levels hover over 10x for any deals over the $500M mark – 10.5x for $500M-$1B and 11.2x for $1B-$2.5B. Regulators may have expected smaller numbers at this point (almost a decade since the crisis), but the increased focus at the smaller end of the market isn’t likely to change any time soon.





Latest news

Rate hike expectations ease as term SOFR curve flattens
The CME six-month Term SOFR rate reached a recent high of 3.979% on July 28 before retreating to 3.837% as…
3Q26: New loan assets rise to 44% of total lending, a 3-year high
New loan assets as a proportion of total US loan volume make up 44% of the 3Q26 pipeline to date,…

North American GPs dominant as fundraising accelerates
Our PEI Private Credit 200 ranking also shows capital raising increasing overall – and accelerating especially fast for the largest…