


Private Debt Intelligence – 10/7/2024

Private debt fundraising in Europe falls despite rapid pace of deployment
Chart
Download Data
[wpdm_package id=’72493′]
Read more in Preqin’s Insights+ Report: Alternatives in Europe 2024
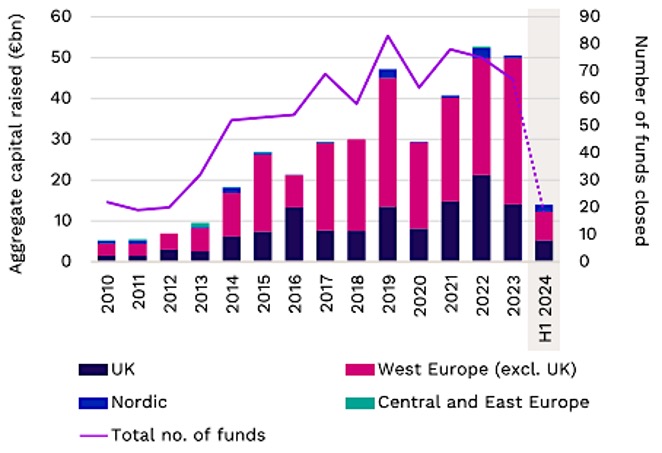
After two record fundraising years in 2022 (€54.1bn) and 2023 (€71.0bn) for private debt, there has been a sharp decline in capital raised by Europe-based managers. In the first half of 2024, just €13.9bn was raised from 18 funds, lagging the 75 raised in 2022, and the 67 in 2023.
Despite the increase in funds raised, private debt dry powder steadily decreased from $450bn in 2021 to $394.1bn in December 2023, as GPs were able to find plenty of opportunities to deploy capital. As a proportion of assets under management, private debt dry powder has dropped from 40.1% in 2018, to 25.7% in 2023, indicating that despite the market’s rapid growth the balance of supply and demand is still tilted in lenders’ favour.
Contact: William Bennett-Lynch
william.bennett-lynch@preqin.com



Latest news

US Leveraged Loans Return 3.36% to Investors YTD
The Bloomberg US Leveraged Loan Index (Ticker: LOAN) returned 0.96% in August and has gained an additional 0.28% through September…

PE dry powder
The capital that is being raised is flowing overwhelmingly to the largest, most established managers.

Middle market debt held by BDCs vs High yield vs Treasury yields
The blue line represents the current dividend yield of the VanEck BDC Income ETF (BIZD), which stood at 11.7% as…