



Our latest fundraising data shows funds are now much less likely to fall short of their capital-raising aspirations.
The most obvious indication that private credit fundraising is in rude health is the headline fundraising number for the first half of the year – referenced in this column last week. At around $219 billion, it puts the asset class on track for a record 12 months.
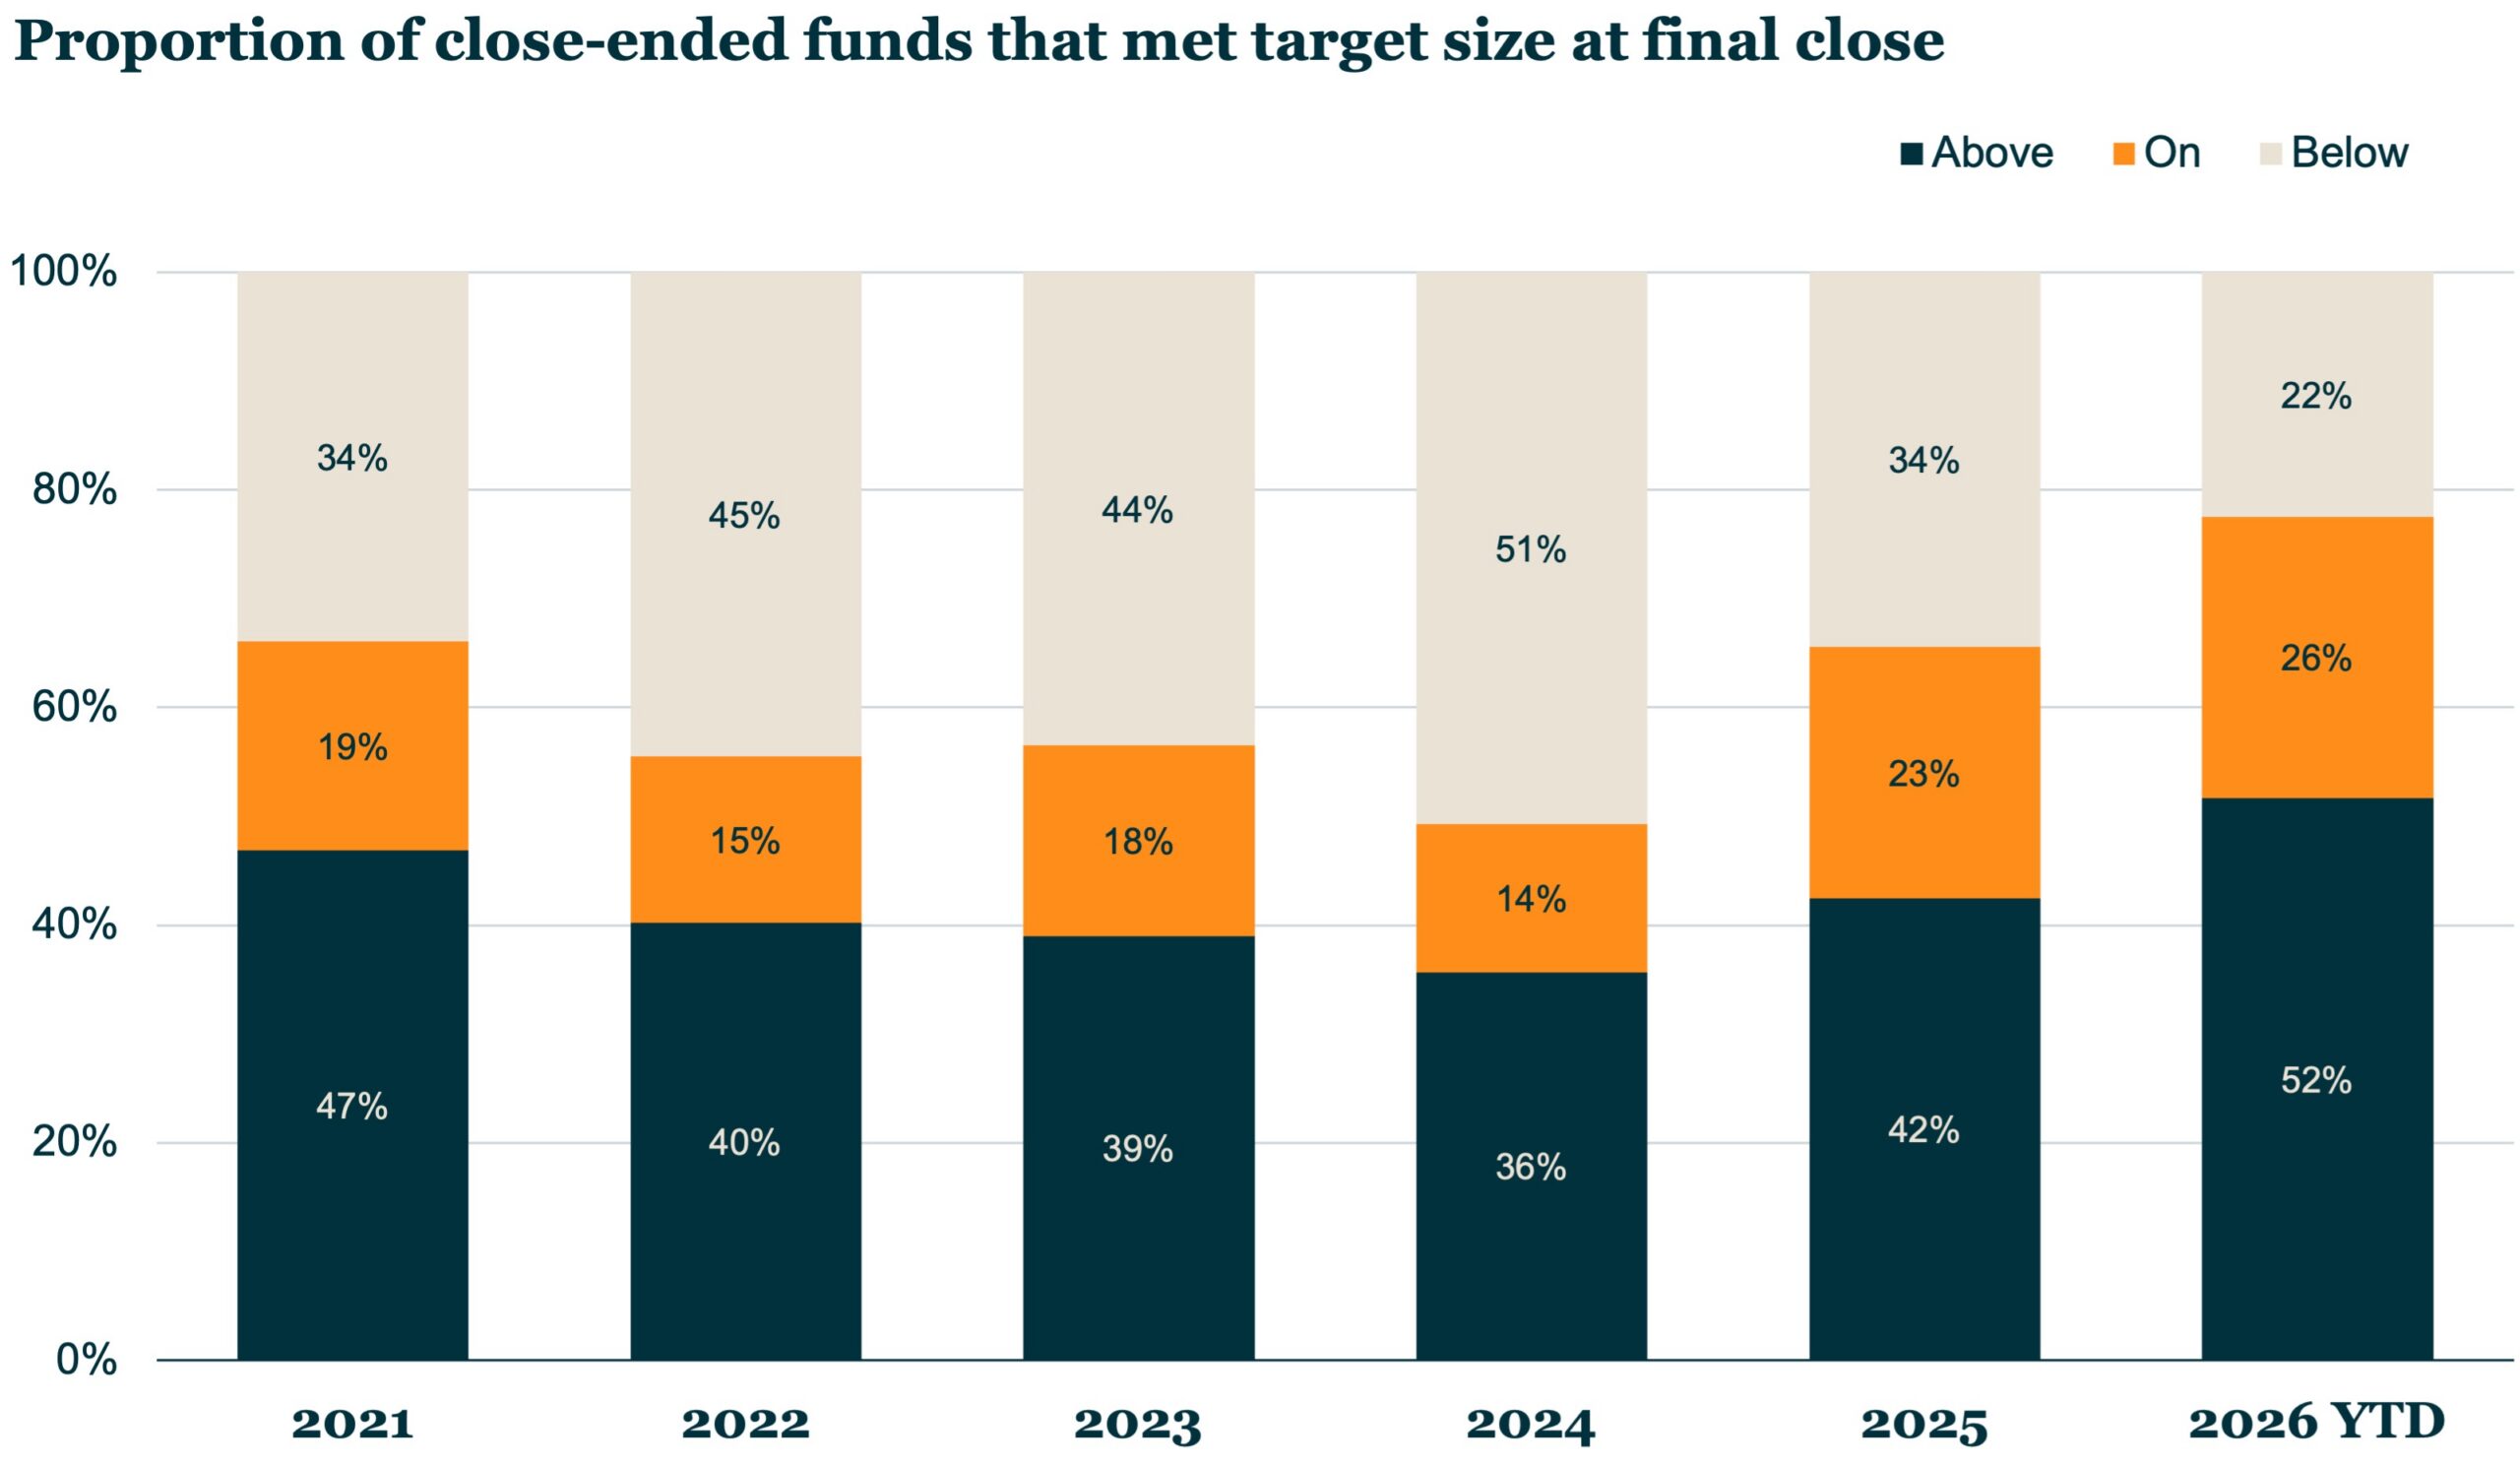
But underneath that headline, there’s another metric that speaks equally well to institutional enthusiasm. If you look back over recent years, it’s striking that private credit funds have not been particularly good at hitting their target amounts. Indeed, just two years ago, in 2024, more than half of funds (51 percent) were failing to attain the amount they had set their sights on (see chart).
If you take the average of the past five years, almost 42 percent of funds failed to hit target. But the outcome from H1 2026 was very different: only 22 percent fell short, compared with 52 percent that finished above target and 26 percent on target.
One possible conclusion is that targets have been adjusted downwards to more pragmatic levels. However, as the finding emerges alongside such promising overall fundraising numbers, it seems fair to view it as evidence that private credit support is at very healthy levels.
If that’s true, then it bodes well for those funds currently in the market. There’s certainly no shortage of them. Our data reveals more than $497 billion of capital in the process of being raised globally: $196 billion of that for North America-focused funds, almost $140 billion for Europe-focused funds and nearly $118 billion for multi-regional funds, with Asia-Pacific accounting for most of the remainder.



Latest news

US Leveraged Loans Return 3.36% to Investors YTD
The Bloomberg US Leveraged Loan Index (Ticker: LOAN) returned 0.96% in August and has gained an additional 0.28% through September…

PE dry powder
The capital that is being raised is flowing overwhelmingly to the largest, most established managers.

Middle market debt held by BDCs vs High yield vs Treasury yields
The blue line represents the current dividend yield of the VanEck BDC Income ETF (BIZD), which stood at 11.7% as…