



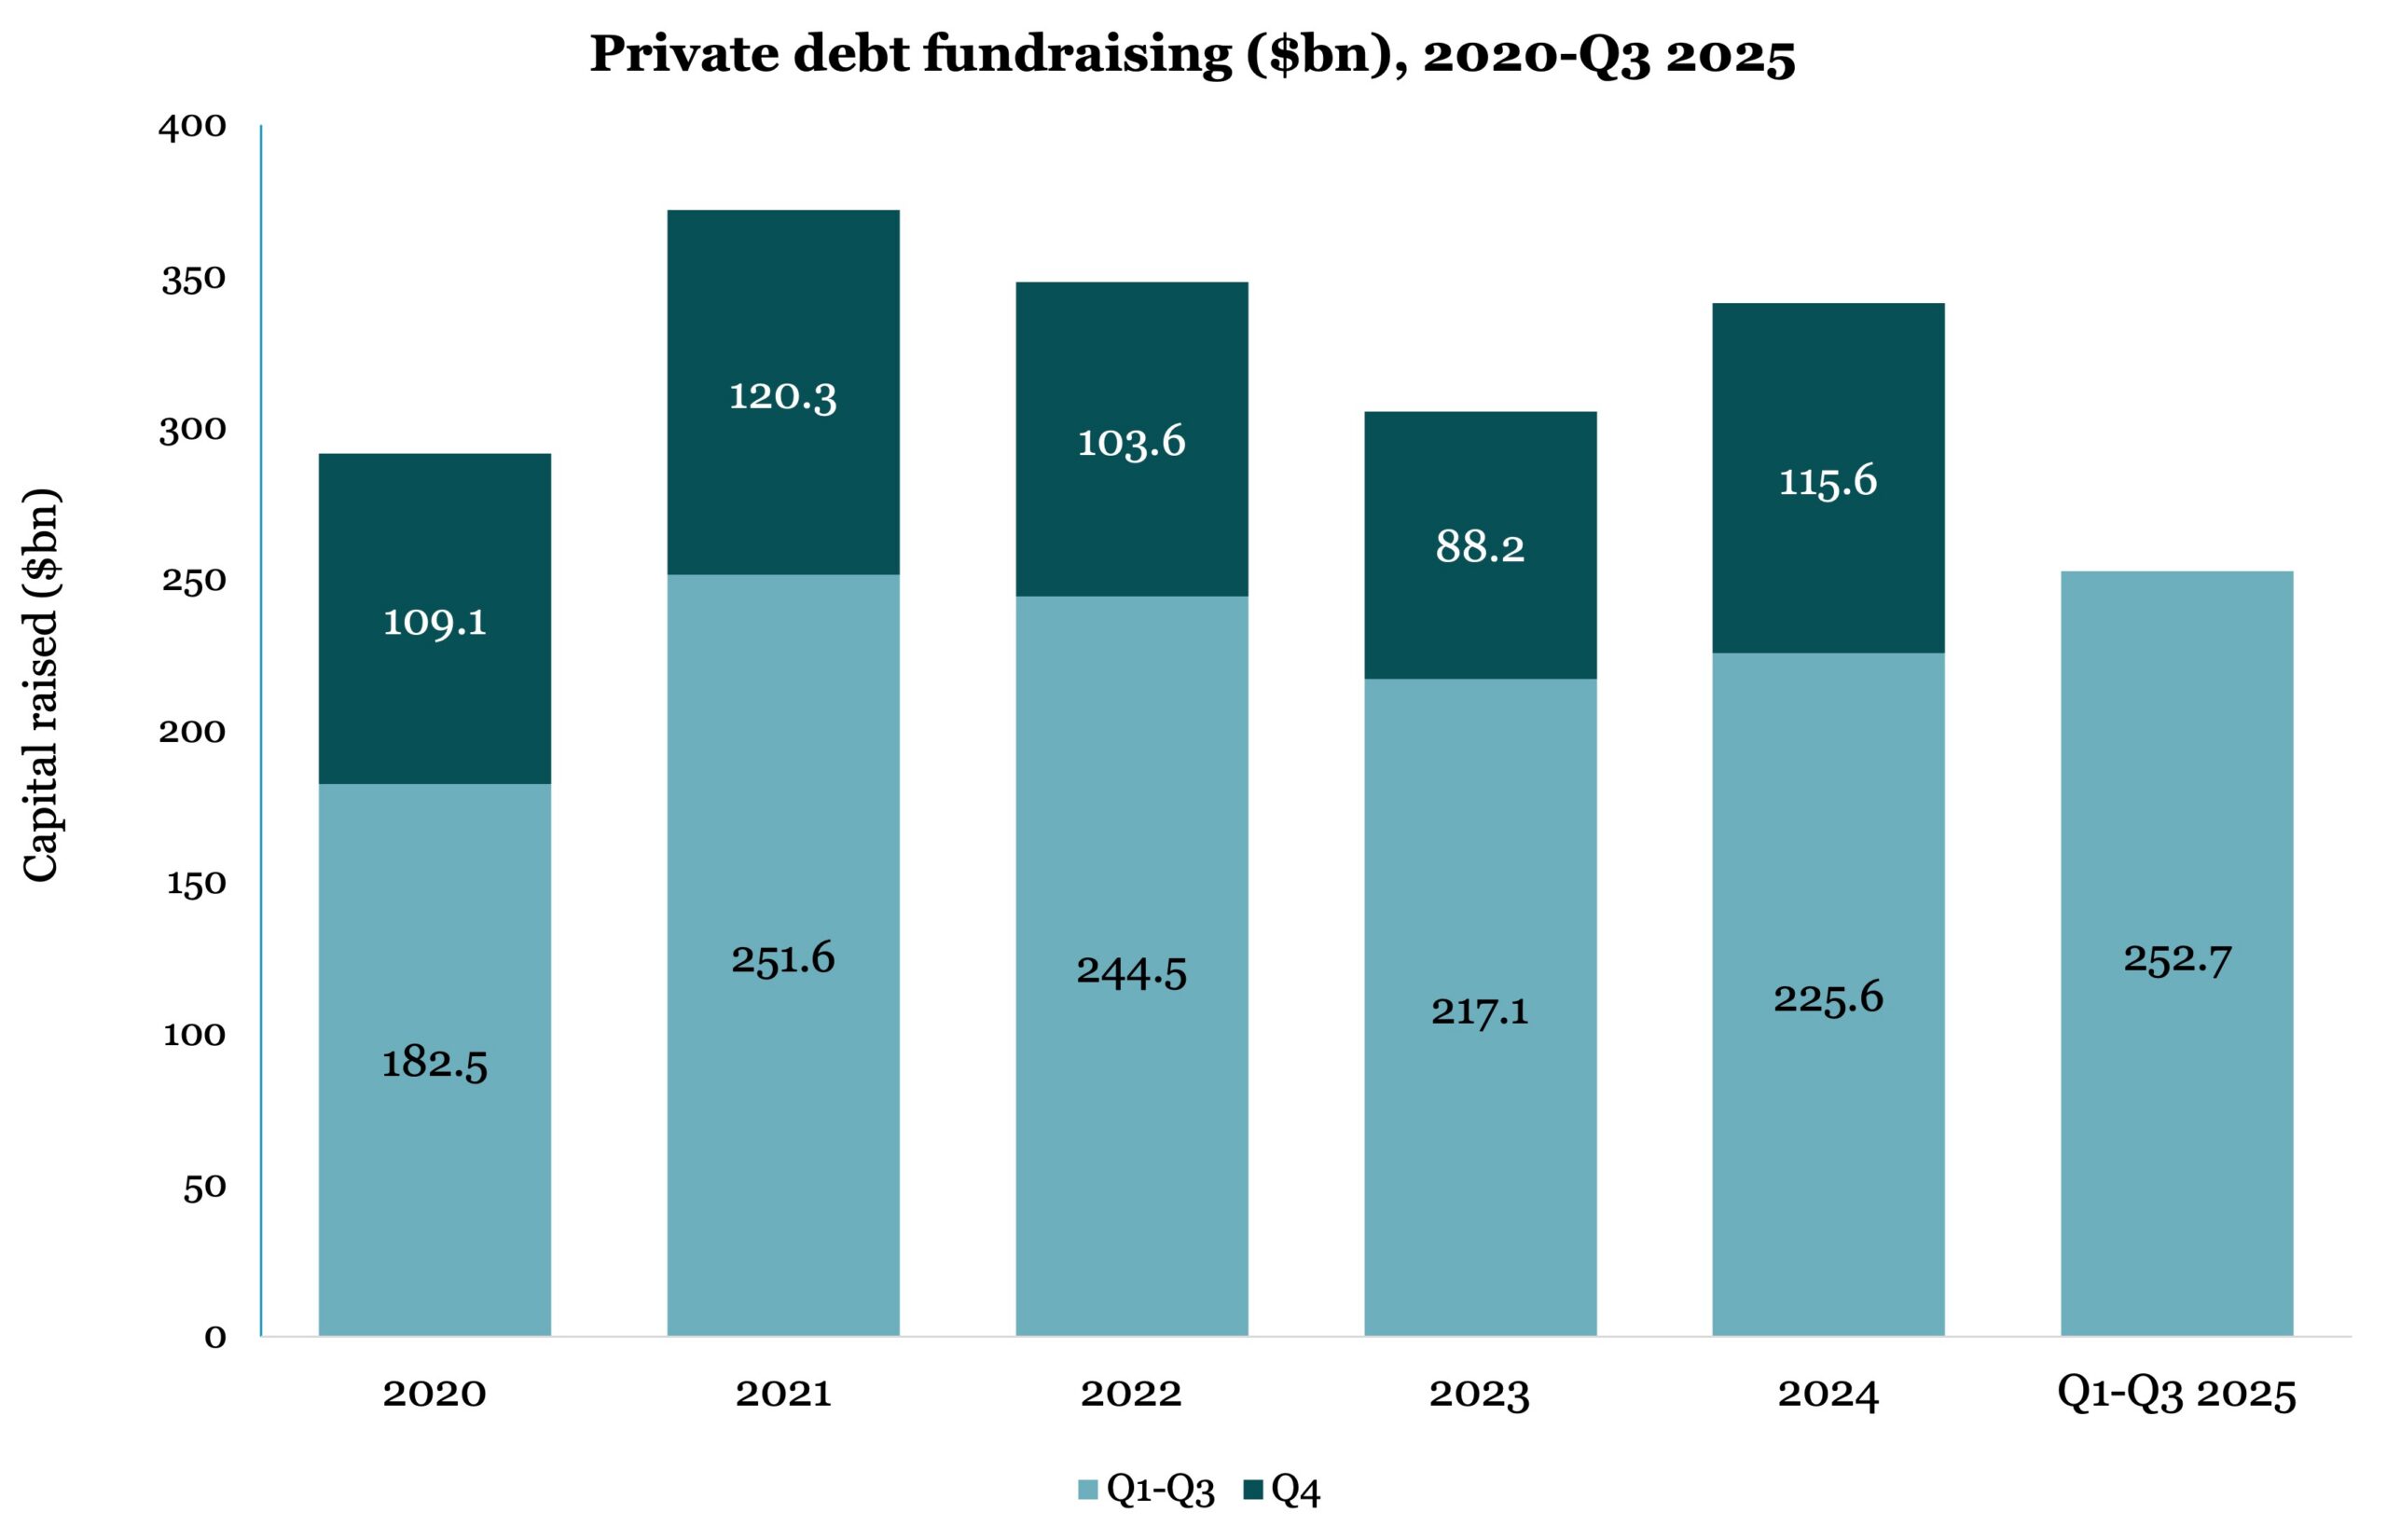
The Liberation Day announcement put the brakes on capital accumulation in Q2, but it’s come roaring back.
Having looked on course for an average year of fundraising at the halfway mark, private debt managers are now on target to have their most fruitful 12 months of the last five years.
Private Debt Investor data, covering January to September 2025, reveals that $252.7 billion was raised globally during that period – beating the totals reached in the equivalent periods back to, and including, 2020.
In that five-year time-frame, the previous highest total for the first three months was the $251.6 billion total recorded in 2021. That year is regarded as the all-time peak of private debt fundraising, with almost $372 billion raised in the year as a whole. The fourth quarter is typically the strongest fundraising period of the year.
After senior debt strategies’ domination of fundraising last year – when they accounted for 65 percent of the total – this year has seen a much more balanced spread of fundraising by strategy. Senior debt still leads the way at 36 percent, but other strategies have claimed material shares with subordinated/mezzanine debt at 22 percent, secondaries at 16 percent (a big increase on previous years) and distressed debt at 14 percent.
Corporate lending continues to dominate when it comes to sector focus, with 79 percent of the total raised in the first nine months, only slightly down on the 81 percent it accounted for last year. Real estate comes next on 15 percent.
In terms of regional focus for funds raised, the year so far shows multi-regional strategies moving ahead of North America – with $105.7 billion raised for the former and $96.6 billion for the latter. This reflects investor concern over the volatility being seen in the US, although Europe – tipped for big things – still lags behind on $45.9 billion.
The average size of closed-end vehicles has continued the rise seen over many years – with the 2025 average standing at just over $994 million, compared with around $925 million for the whole of last year.



Latest news

US Leveraged Loan Issuance Rebounds in September
Following three consecutive months of declining issuance, the US leveraged loan market has reversed course in September. Approximately $48.7b of…

Reversion to the Mean
Climbing toward the average is a very different story than surpassing it.
