



The percentage of LBO deals with leverage levels greater than six times is returning to 2007 levels. So far in 2014, LPC tracked 40 LBO (where deal details were available) deals or 55% of the total with total leverage greater than the regulators’ benchmark 6 times debt to EBITDA.
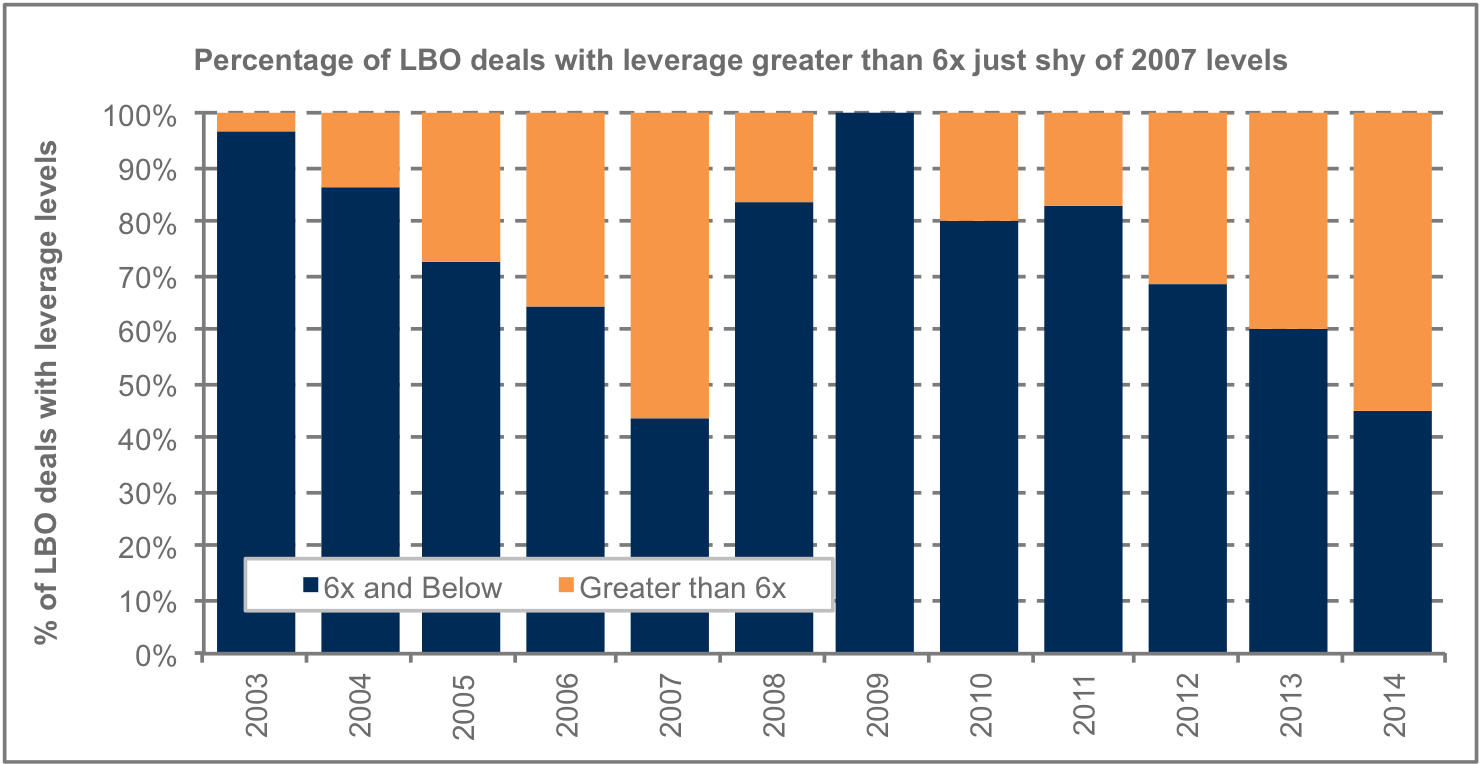
Back in 2007, the percentage was 57%. Leverage has been steadily climbing since 2010 as a shortage of M&A deals has allowed sponsors the ability to borrow deeper in recent years. Based on both large corporate and institutional middle market deals tracked by LPC, the average total debt to EBITDA has climbed to 6.1 times this year, up from 5.85 times in 2013 and 5.5 times in 2012. However, this figure is still more conservative than 2007’s 6.5 times. Still, several very aggressive deals have hit market this quarter. Based on data from Moody’s Investor Service, the following deals all had adjusted leverage of 8.0 times and greater this quarter: Internet Brands, Advantage Sales & Marketing, Healogics, and Ipreo. Underliers
Register now for LPC’s 20th Annual Loan Conference on Sept. 18th New registrations use PROMO “LEADLEFT2014”.



Latest news

US Private Credit Transparency Highlights Uneven BDC Performance
Credit performance across business development company (BDC) portfolios remains uneven, although reported losses and non-accruals were broadly stable quarter over quarter, according to Fitch Ratings’ Private Credit Transparency Monitor for 2Q26.

Density of TVPI at 10 years after inception by fund size
Marquee managers seem to be victims of their own success. Strong performance brings in more capital, and the desire to grow AUM and please public shareholders inevitably leads to returns clustered around the market average.