



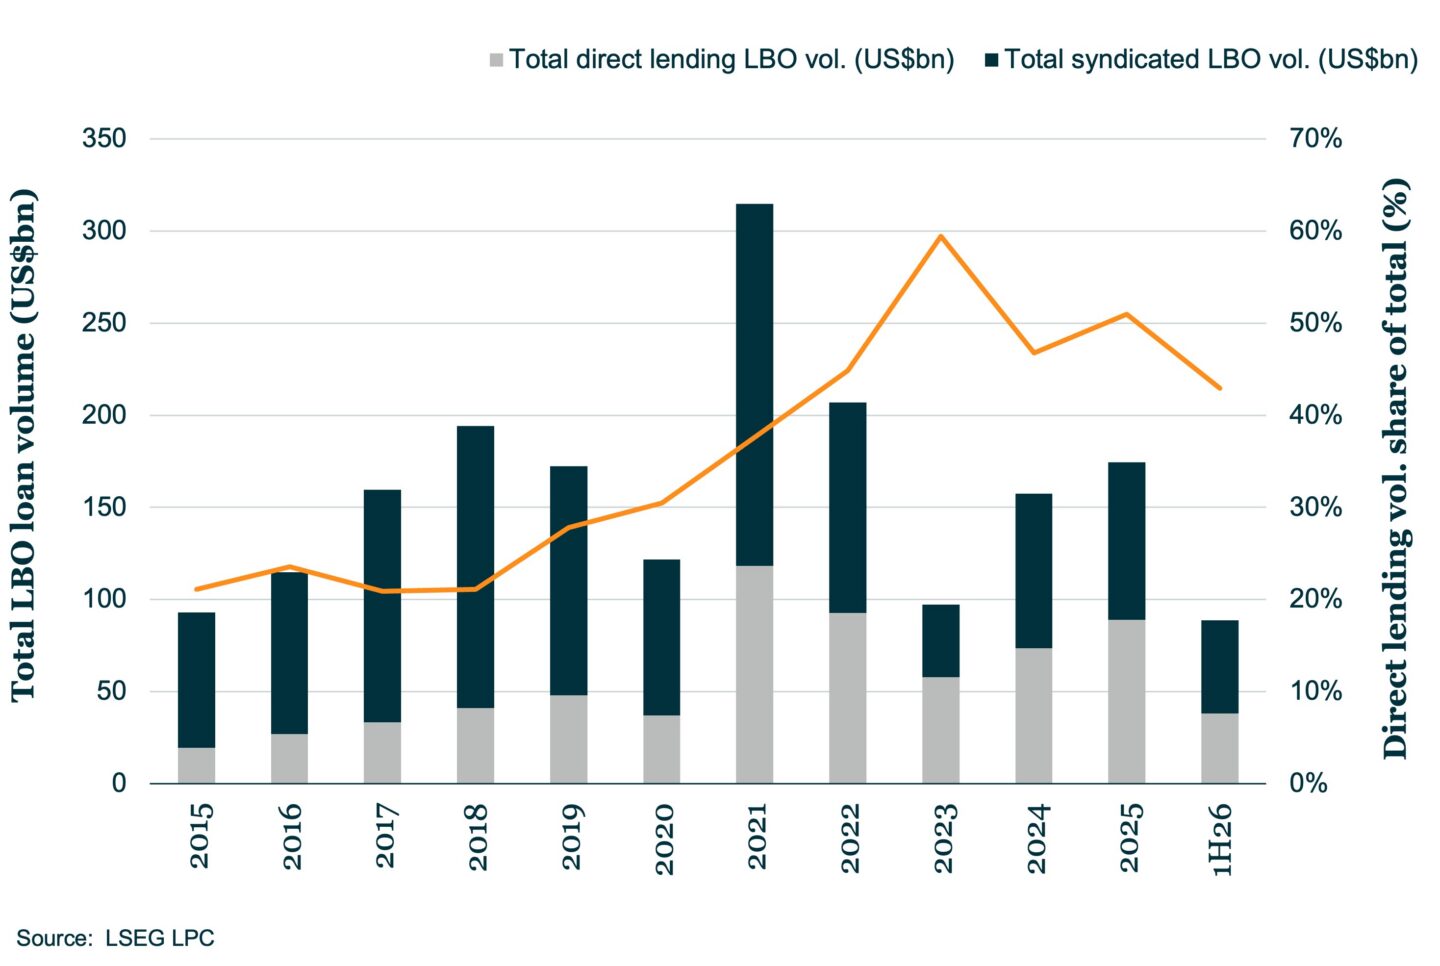
US lenders completed a combined US$34bn of syndicated (US$16.94bn) and direct lending (US$$16.6bn) loan volume backing leveraged buyout activity ub 2Q26, pushing half year totals to just under US$90bn. Quarter over quarter, issuance was down among both syndicated and direct lending executions amid entrenched higher valuations and fluctuating market volatility. The syndicated market observed a 50% drop in the 2Q26 calendar compared to 1Q26 totals while the direct lending market saw issuance decline 22% quarter over quarter. However half year totals among LBOs executed via the syndicated market were up over 51% year over year at US$50.6bn. In contrast, direct lender constructs edged down 5% totalling just over US$38bn, amid interest rate pressure and headlines spotlighting potential risks in direct lender portfolios . In turn, direct lending ultimately represented 43% of total LBO financing completed in 1H26, down from 51% in full year 2026.




Latest news

M&A activity begins to tick upward
In the third quarter of 2026, acquisition-linked loan volume across North America and Europe reached about $47 billion, up from $30.6 billion in Q2 and $29.5 billion a year ago.


$1trn and counting
Investor allocations to private credit climbed by nearly a quarter year-on-year as positive sentiment shows no sign of weakening. The…