


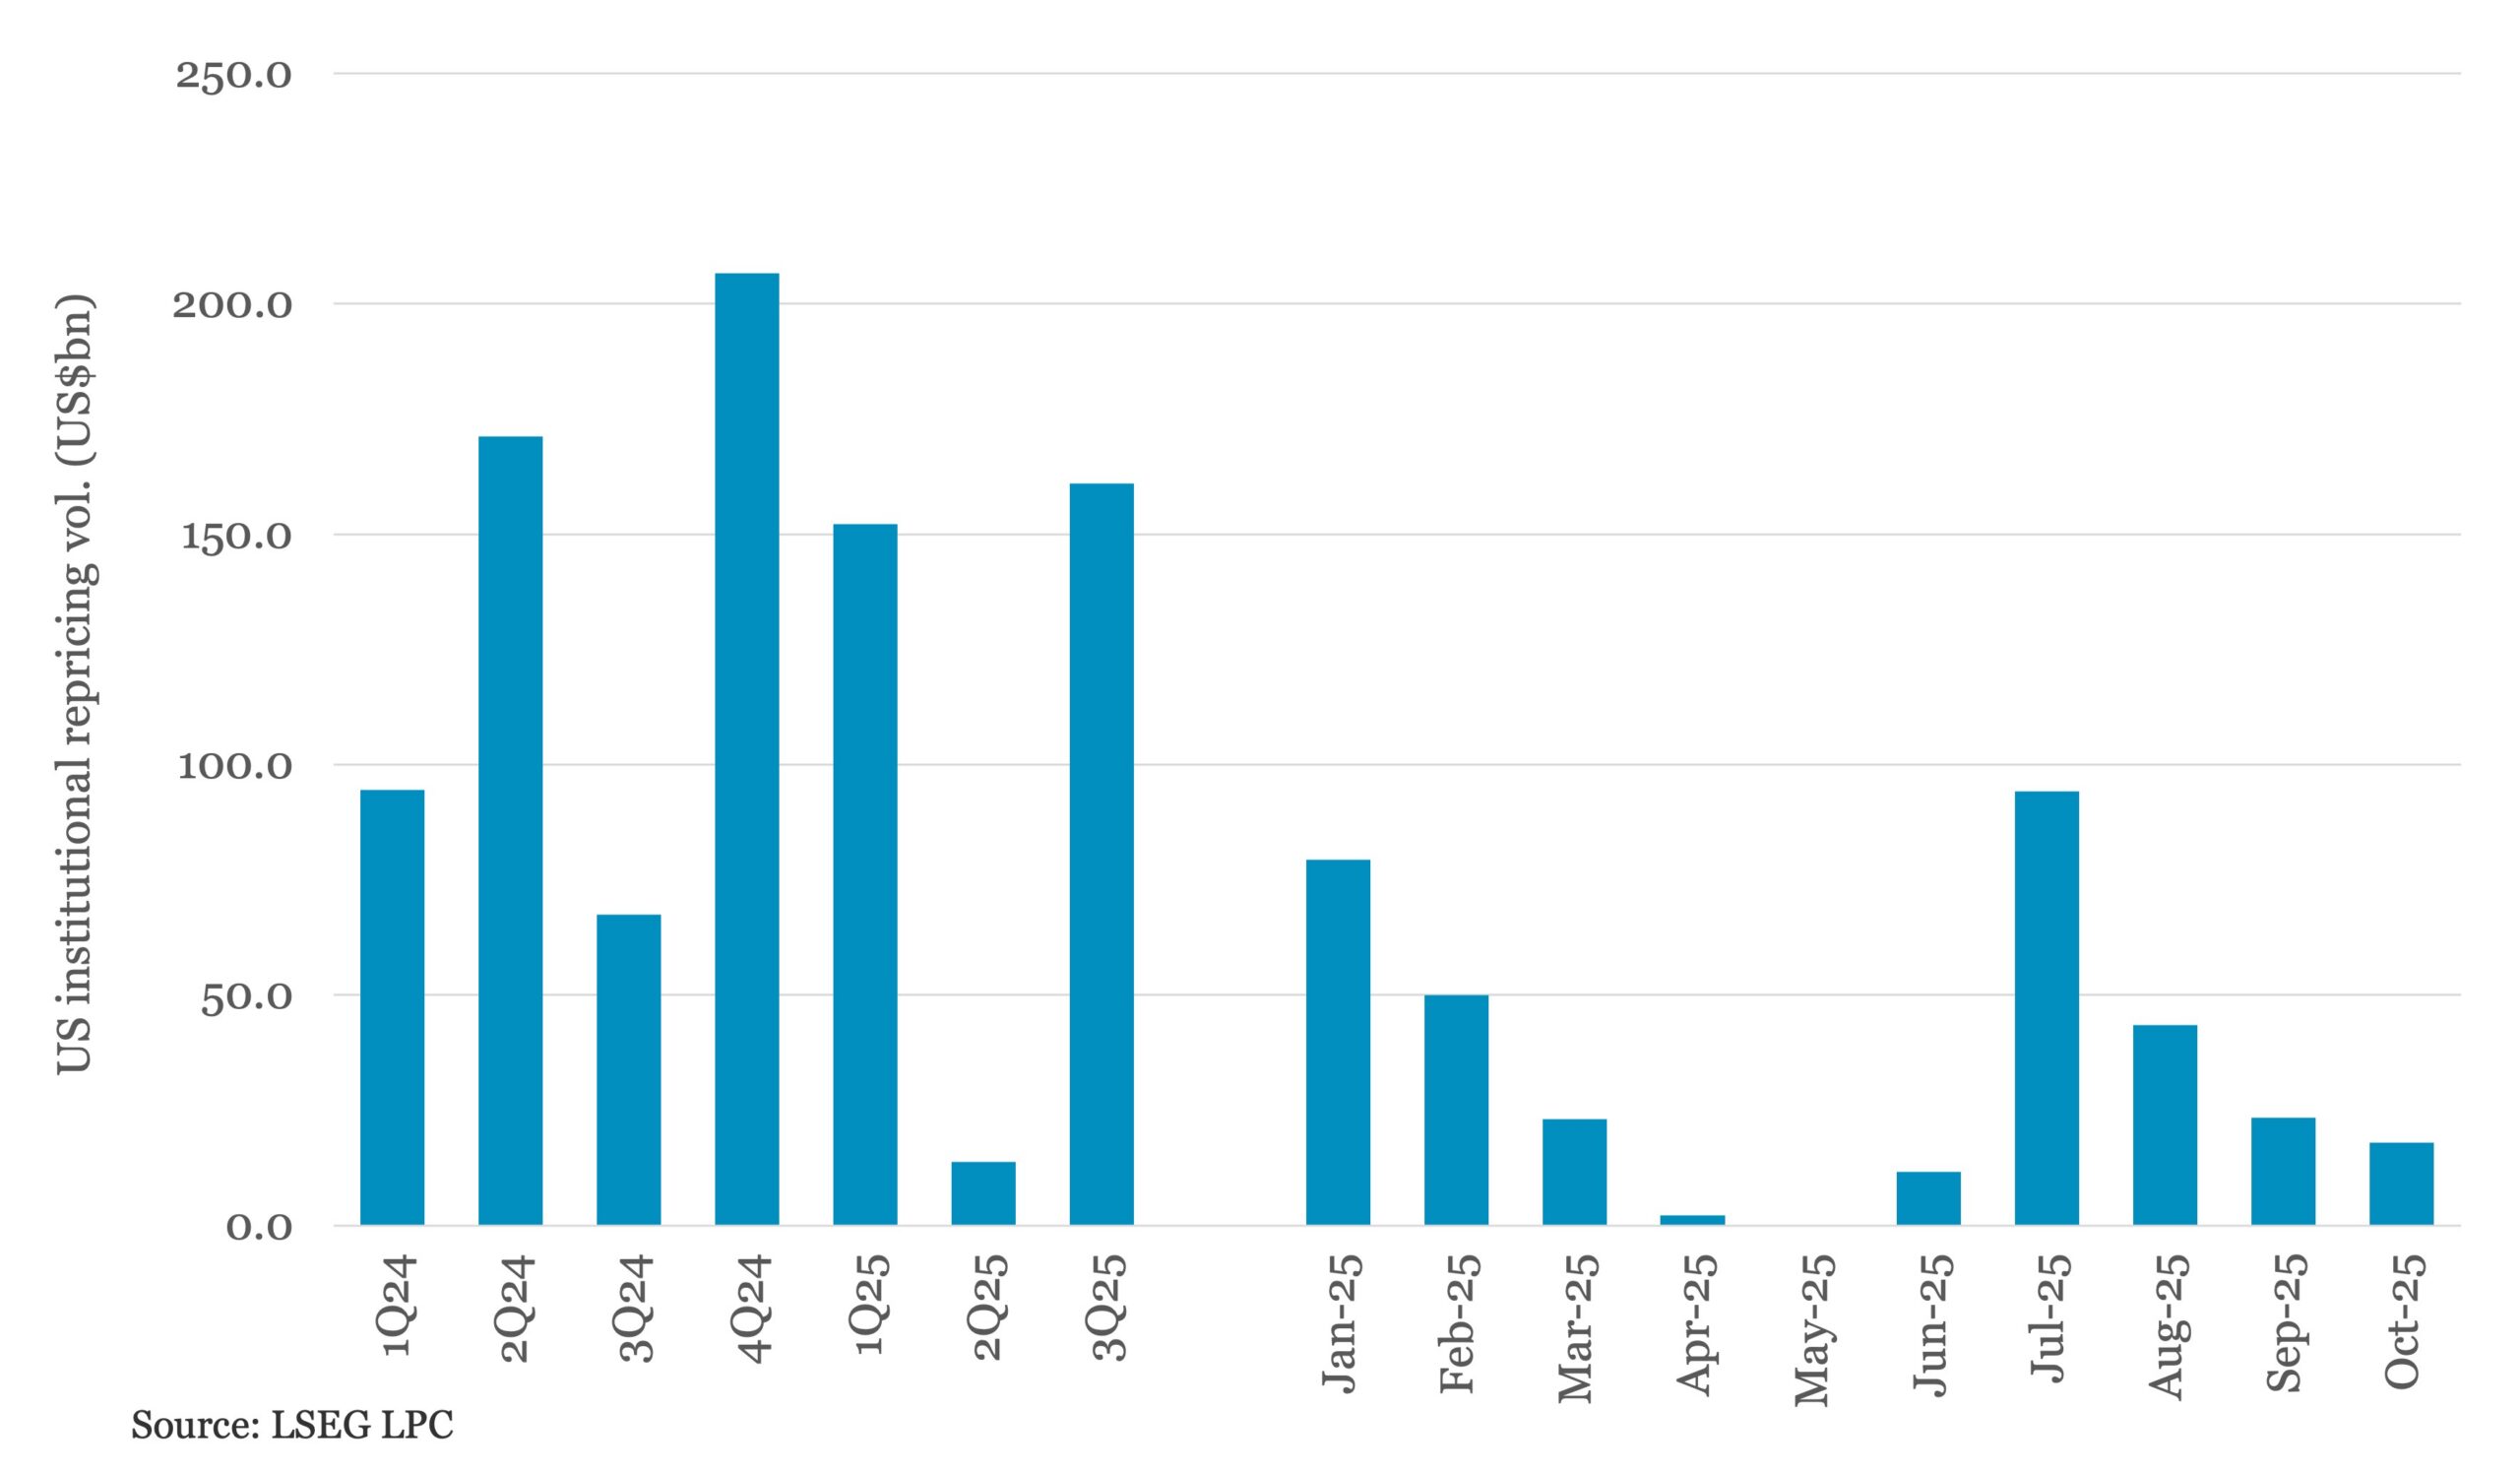
US repricings slow in early 3Q25 as new loan assets re-emerge

LSEG (1)
Content hub / Article / LSEG / US repricings slow in early 3Q25 as new loan assets re-emerge

US leveraged lenders completed just under US$18bn of repriced institutional loan volume during the month of October, down from over US$23bn in September and less than half of August totals (US$43bn) and one fifth of July results (US$94.2bn).  Most of the drop off is attributed to the building leveraged pipeline.  October saw over US$24.5 of new leveraged institutional loan assets clear the market, the greatest monthly total so far this year.  Almost US$18bn or 74% came in the form of M&A financing.

Contact Maria Dikeos
Making sense of private credit defaults

Webinar

Making sense of private credit defaults

What does private credit default data really tell us? Join our exclusive webinar featuring experts from KBRA, Moody's, Fitch Ratings, and S&P Global to find out.
Register
Credit Journal-Private Credit

Report

Credit Journal-Private Credit

Fitch Ratings’ latest Credit Journal series is a subject-specific, curated compilation of in-depth research and commentary. This edition explores the growing world of private credit, including non-bank lending across business development companies.
Download
PitchBook's US PE Middle Market Report

Report

PitchBook's US PE Middle Market Report

The middle market is off to its best start to a year since 2021, but its share of PE keeps slipping.
Download
Private Debt Investor New York Forum

September 15-16, Hudson Yards, New York

Private Debt Investor New York Forum

Bringing together the investors, managers and advisers shaping the next phase of the market — 200+ allocators and $10.6 trillion of LP capital expected. Benchmark strategies, hear from leading LPs, and cut through market noise over two unmissable days.
Learn more

Latest news

    Concentrated Effort

    The upper middle market tends to have clear favorite. Source: KBRA DLD Research

    Read More

    Business of Private Credit: Sectors and SIC Codes

    We’ve spent the last few weeks covering the businesses of the core middle market. Does that same discipline hold when you move up market?

    Read More

    Middle market debt held by BDCs vs High yield vs Treasury yields

    The blue line represents the current dividend yield of the VanEck BDC Income ETF (BIZD), which stood at 12%. The…

    Read More





