



Download PitchBook’s Report here.
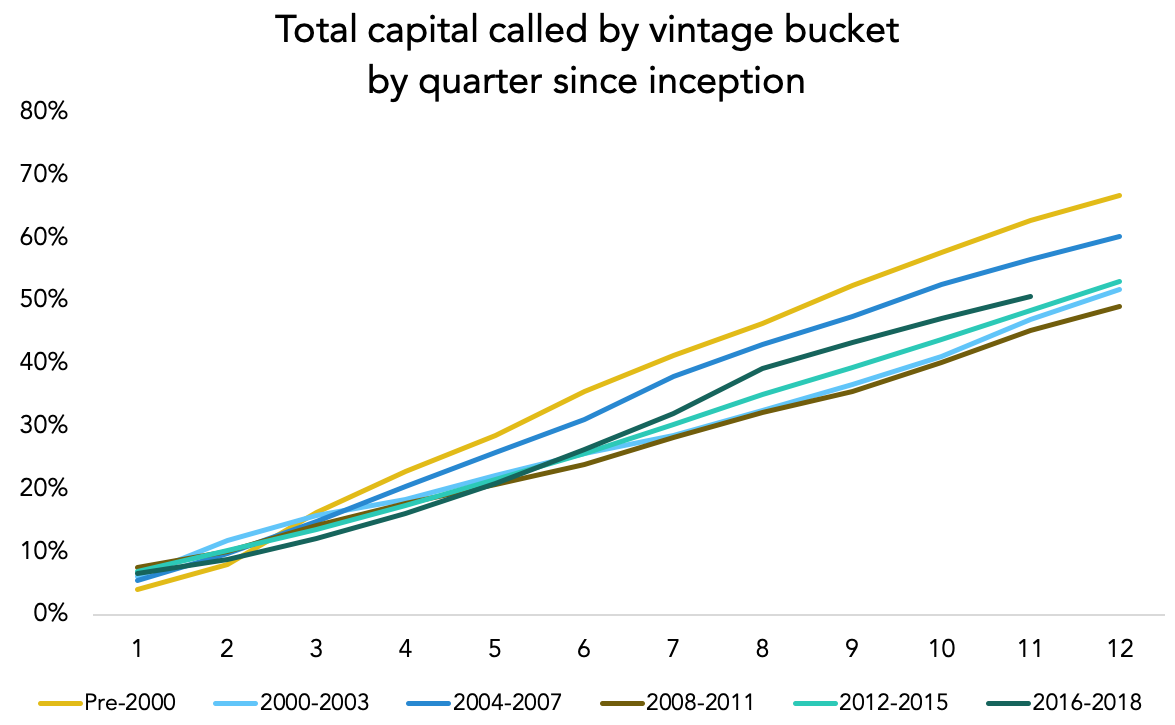
Record years for PE activity are often viewed as fast-moving frenzies, but capital call statistics show the industry is investing much more slowly than it has in the past. Drawdown rates have been relatively slow since 2012, even though 2014, 2015, 2016, 2017 and 2018 were all record years for deal volume. That’s partially due to more buyout shops in the market—it wasn’t until 2017 that the number of active PEGs actually went down year-over-year, which was a first. It’s a much bigger industry moving at a slower pace these days. For example, pre-2000 vintages had, on average, called down about 67% of their capital by each fund’s three-year mark. By contrast, 2012-2015 vintages had called down just over half (53%) by the same point, according to our latest Benchmarks Report.
Much more broadly, though, drawdown rates appear to ebb and flow depending on market dynamics. Capital is deployed more quickly in positive economic environments, hence the two “quickest” vintage buckets were pre-2000 and 2004-2007. Pre-2000 vintages called down more than half of their capital almost a full year faster than 2016-2018 vintages did. The inverse is also true, with recession-era vintages deploying capital at a visibly slower pace. It took 13 quarters for 2008-2011 vintages to draw down half of their fund commitments compared to just 10 quarters for the 2004-2007 bucket. PE firms behave like the rest of us in some ways, exuberant when prices are high but trigger-shy when they drop. They just have to pay attention to the clock more than we do.





Latest news

Rate hike expectations ease as term SOFR curve flattens
The CME six-month Term SOFR rate reached a recent high of 3.979% on July 28 before retreating to 3.837% as…

3Q26: New loan assets rise to 44% of total lending, a 3-year high
New loan assets as a proportion of total US loan volume make up 44% of the 3Q26 pipeline to date,…

North American GPs dominant as fundraising accelerates
Our PEI Private Credit 200 ranking also shows capital raising increasing overall – and accelerating especially fast for the largest…