Debtwire

Debtwire Middle-Market – 5/15/2023

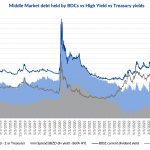
Source: VanEck BDC Income ETF and BofA Merrill Lynch US High Yield Effective Yield The red line in the chart is the current dividend yield of the *VanEck BDC Income ETF (BIZD) that tracks the overall performance of publicly traded business development companies (BDCs, lenders to privately held middle-market businesses that tend to be below…

Debtwire Middle-Market – 5/8/2023

Defaults are expected to face prolonged rise Source: Debtwire Par Bubbling up: defaults continue year-long rise Default rates have been increasing steadily month-on-month (MoM) from a low in February 2022 of only 0.4% to over 2% of the loan universe as of March 2023. Bond rates have similarly been on the rise over the same…

Debtwire Middle-Market – 5/1/2023

Source: VanEck BDC Income ETF and BofA Merrill Lynch US High Yield Effective Yield The red line in the chart is the current dividend yield of the *VanEck BDC Income ETF (BIZD) that tracks the overall performance of publicly traded business development companies (BDCs, lenders to privately held middle-market businesses that tend to be below…

Debtwire Middle-Market – 4/24/2023

New money issuance drops in 2023 Source: Debtwire Par While overall leveraged loan issuance was down 23% year on year to USD 225bn at the end of the first quarter, refinancing activity gained 35% year-on-year for all loans and 30% for institutional facilities. This reflects the significant lack of M&A activity driving issuance contrasting the…

Debtwire Middle-Market – 4/17/2023

Source: VanEck BDC Income ETF and BofA Merrill Lynch US High Yield Effective Yield The red line in the chart is the current dividend yield of the *VanEck BDC Income ETF (BIZD) that tracks the overall performance of publicly traded business development companies (BDCs, lenders to privately held middle-market businesses that tend to be below…

Debtwire Middle-Market – 4/3/2023

Source: Cliffwater Direct Lending Index and BofA Merrill Lynch US High Yield Effective Yield The red line in the chart is the *Cliffwater Direct Lending Index (CDLI) current yield, which is based on the investment income of the underlying assets held by public and private BDCs. BDCs invest in middle market companies, and the Index…

Debtwire Middle-Market – 3/20/2023

Source: Cliffwater Direct Lending Index and BofA Merrill Lynch US High Yield Effective Yield The red line in the chart is the *Cliffwater Direct Lending Index (CDLI) current yield, which is based on the investment income of the underlying assets held by public and private BDCs. BDCs invest in middle market companies, and the Index…

Debtwire Middle-Market – 3/6/2023

Source: Cliffwater Direct Lending Index and BofA Merrill Lynch US High Yield Effective Yield The red line in the chart is the *Cliffwater Direct Lending Index (CDLI) current yield, which is based on the investment income of the underlying assets held by public and private BDCs. BDCs invest in middle market companies, and the Index…

Debtwire Middle-Market – 2/21/2023

Source: Cliffwater Direct Lending Index and BofA Merrill Lynch US High Yield Effective Yield The red line in the chart is the *Cliffwater Direct Lending Index (CDLI) current yield, which is based on the investment income of the underlying assets held by public and private BDCs. BDCs invest in middle market companies, and the Index…

Debtwire Middle-Market – 2/6/2023

Source: Cliffwater Direct Lending Index and BofA Merrill Lynch US High Yield Effective Yield The red line in the chart is the *Cliffwater Direct Lending Index (CDLI) current yield, which is based on the investment income of the underlying assets held by public and private BDCs. BDCs invest in middle market companies, and the Index…