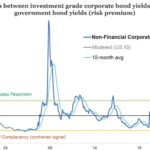
Chart of the Week: Premium Yields
Spreads for middle market CLOs are distributed higher than their BSL counterparts. Source: S&P Global Ratings
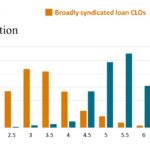
Spreads for middle market CLOs are distributed higher than their BSL counterparts. Source: S&P Global Ratings

Since the Fed began its rate hike regime in March 2022, MM CLO activity has grown. Source: PitchBook
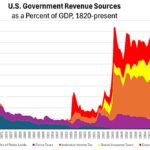
Since the early 1800’s, tariff’s share of US government revenues has shrunk dramatically. Source: The Cato Institute
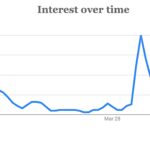
Google searches for “tariff” hit a peak around Liberation Day but have trailed off since. Source: Google Trends
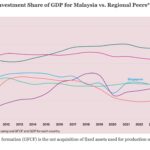
Malaysia’s investment growth lags other ASEAN countries but shows signs of recovery. Source: Department of Statistics, Malaysia. Haver and respective national authorities
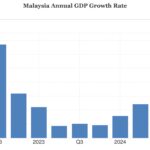
Malaysia’s economy grew 5.1% last year, ahead of 2023; 2025 is tariff-dependent. Source: Department of Economics, Malaysia
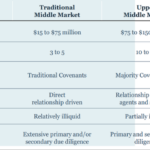
Despite other views, the middle market has three parts, each with their own features. Source: Churchill Asset Management
Australian credit spreads showing signs of bottoming out. Source: The Daily Shot, Topdown Charts, LSEG
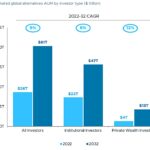
Private wealth investors expected to triple allocation to alternatives by 2032. Source: Bain & Company, GlobalData, Preqin, iCapital
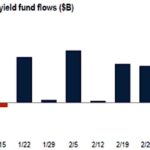
After seven straight weeks of cash in-flows, high-yield funds showed out-flows. Source: Morningstar/PitchBook