Chart of the Week: Loans Unleashed
July set record monthly leveraged loan volume; eight of top ten highest in last two years. Source: PitchBook, Bloomberg

July set record monthly leveraged loan volume; eight of top ten highest in last two years. Source: PitchBook, Bloomberg
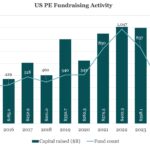
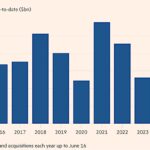
Private equity fundraising through early June is slowest pace in over a decade. Source: PitchBook
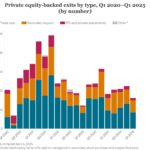
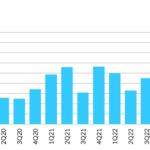
The number of PE exits slumped 1Q after last year’s steady improvement. Source: Preqin Pro
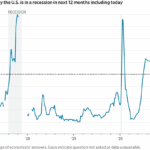
Notwithstanding tariffs, economists now view the chances of a recession fading. Source: WSJ Surveys of Economists
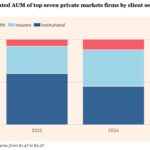
The share of wealth assets dedicated to private credit is on the rise. Source: FT, Oliver Wyman
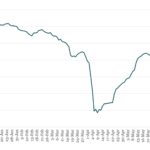
Since Liberation Day, leveraged loan trading prices have slowly moved higher. Source: Bloomberg US Leveraged Loan Index
Since the 2021 peak, global M&A activity has been on the rebound. Source: LSEG
Through Covid and rate hikes, middle market loan issuance has tracked up. Source: LevFin Insights, a Fitch Solutions company
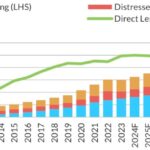
Private credit AUM expected to continue steady growth, driven by direct lending. Source: Fitch Ratings, Preqin
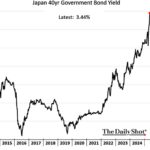
Japan’s long-dated bond yields have moved up sharply so far in 2025. Source: The Daily Shot