Private equity as an asset class delivers strong returns to investors, often better than public market benchmarks (see Chart of the Week). It also diversifies investor portfolios with access to smaller high-growth private companies. As PE becomes available to high-net-worth investors, understanding how these investments work is essential for a sophisticated wealth program.
While the first buyers of middle market companies were not strictly PE firms, so-called leveraged buyouts (LBOs) quickly became their focus...
“There is more of a meeting of the minds between buyers and sellers. I think that’s going to accelerate.” – Steven Wise, co-head, Americas corporate private equity (Bloomberg).
Featuring Charts

Chart of the Week: Inventory Check
Private equity remains an attractive option for investors through cycles. Source: Pitchbook
Read More
Chart of the Week: State of Returns
For over two decades private equity has outperformed public stocks in state pension plans. Source: Cliffwater
Read More
Chart of the Week: Back in the Game
While PE deals transacted shrunk since 2021, deal values rose over past three years. Source: PitchBook
Read More
Chart of the Week: Private Credit Doubles
Direct lending and BDCs expected to lead the growth of private credit. Source: Fitch Ratings
Read More
Chart of the Week: Premium Outlet
The private credit yield advantage over BSL widens as single-B spreads shrink. Source: KBRA DLD Research, PitchBook LCD
Read More
Chart of the Week: Easing Down
Defaults for the overall leveraged loan market are at lowest point since 2023. Source: The Daily Shot, PitchBook/LCD, Morningstar LSTA US Leveraged Loan Index
Read More


Subscribe Now!
Join the leading voice of the middle market. Try us free for 30 days.
Click here to view the Newsletter sample.
What is the Lead Left?

- One-stop source for deals and data
- Market trend commentary and analysis
- Exclusive interviews with thought leaders

View Article By
Features
The Pulse of Private Equity – 1/19/2026

Continuation-fund-related PE exit count Download PitchBook’s Report here. Exits through continuation funds, also known as GP-led secondaries, are one way that sponsors can provide liquidity to LPs while also giving themselves more time to create additional value within their portfolio companies…. Subscribe to Read MoreAlready a member? Log in here...
Bloomberg: Leveraged Lending Insights – 1/19/2026

US Leveraged Loan Launches Top $55bn in Second Week of 2026 The US leveraged loan market kicked off the new year in high gear, with $55.3b worth of deals launching to market during the week ending January 16th. It was the sixth busiest week for launches on record since Bloomberg began tracking the data in…
Leveraged Loan Insight & Analysis – 1/19/2026

US private credit lending continued on its upward trajectory in 4Q25, driven by a jump in new money financings US direct lending sponsored volume climbed to US$109bn in 4Q25, an increase of 19% from the prior quarter. This uptick was driven by add-on M&A (+78%) and LBOs (+23%), which helped push new money financings up…
PDI Picks – 1/19/2026

Insurers top of allocations table But our Investor Report finds that around two-thirds of institutions consider themselves under-allocated to the asset class. Public pensions may be the typical investor in private credit – accounting for 46 of the top 75 allocators to the asset class in Private Debt Investor’s annual Global Investor 75 ranking – but insurance companies are the ones apparently prepared to carve out the…
Middle Market & Private Credit – 1/19/2026

Life Insurer Investment Portfolios to Remain Broadly Stable in 2026 Click here to learn more. Life insurers’ investment portfolio mix should remain broadly stable, with solid credit quality and core fixed income dominant amid a continued tilt toward private credit and alternative investments, driven by opportunistic repositioning and regulatory reclassifications…. Subscribe to Read MoreAlready a
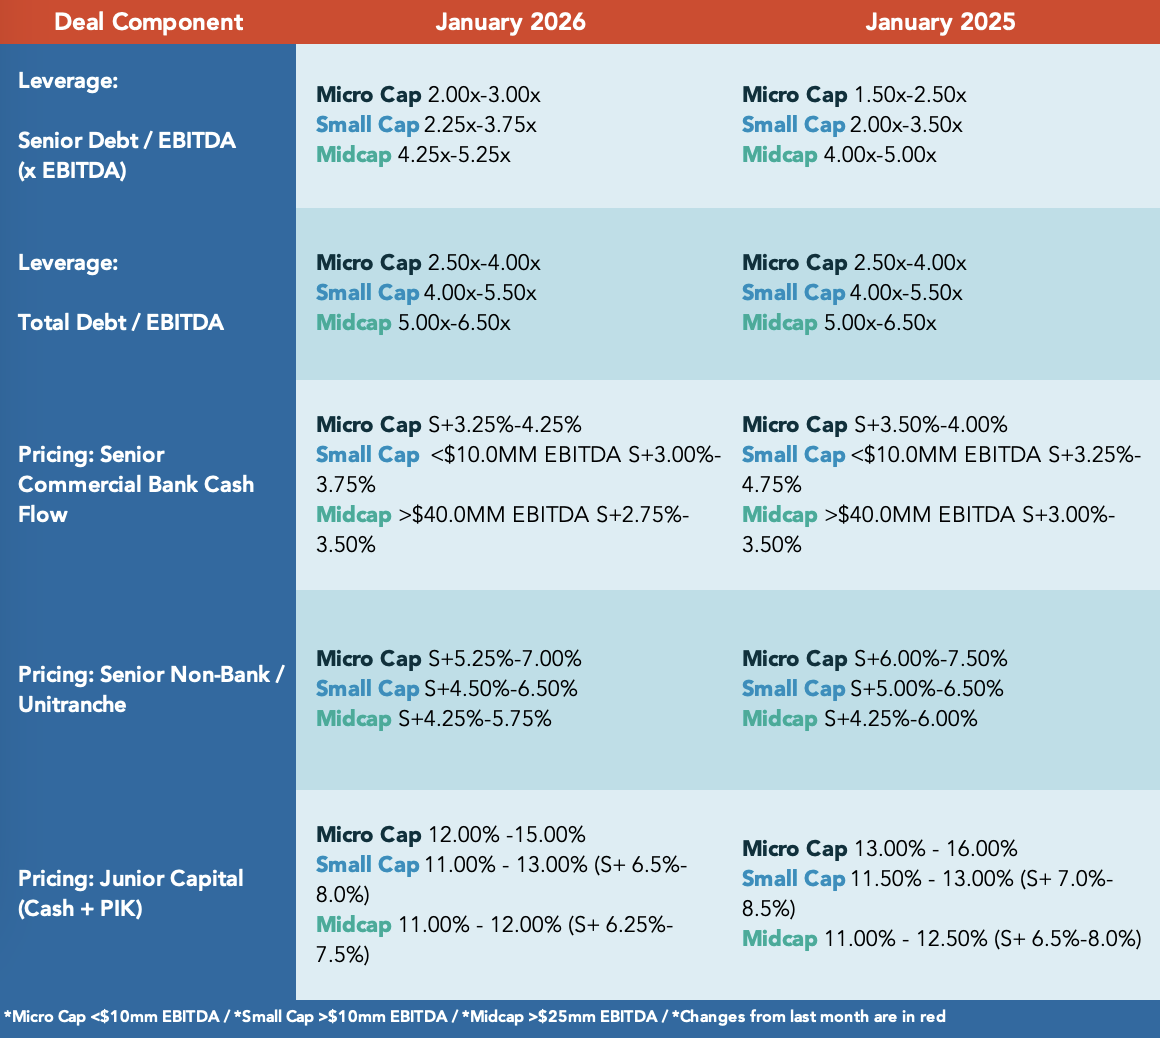
Middle Market Deal Terms at a Glance
provided by
![]()

Beginning in July 2022 The Lead Left published a series of articles on credit market. This report consolidates those articles.

Cov-lite trends Inflation & rising interest rates – LIBOR to SOFR transition Mega-tranche uni trend ESG takes center stage Login to view interactive report and download PDF version. … Subscribe to Read MoreAlready a member? Log in here Related posts: 2H 2021 Midyear Outlook Report State of the Capital Markets – Fourth Quarter 2016 Review and

Beginning in September 2021 The Lead Left published a series of articles on supply chain. This report consolidates those articles.
Our Content Partners