Our first visit to Oman last week was remarkable in several respects. We were reminded again how regional countries – whether in Europe, Asia, or MENA – can be so similar yet so different.
Oman, like Saudi Arabia, Kuwait, Qatar and the UAE, is a monarchy, yet is unique in being a sultanate. It is also the oldest independent state in the Middle East. Its tourism sites are as spectacular as they are relative unknown [link]. The most popular beverage is Mountain Dew, which could account for the high energy level we noted among residents...
“For investors, the [six-member Gulf Cooperation Council] still benefits from moderate to low levels of debt, supported by favourable credit ratings and vast sovereign assets.” – Carla Slim, MENA economist, Standard Chartered Bank (FT).
Featuring Charts

Chart of the Week: Up and To the Right
Oman’s economy is expected to increase steadily through the end of the decade Source: Statista
Read More
Chart of the Week: Slow as it Goes
Quarterly direct lending deals peaked 2Q 2024, slowed since. Source: PitchBook LCD, US data through Sept. 16, 2025.
Read More
Chart of the Week: Where’s the Beef?
A PitchBook survey showed private credit participants most worried about finding new deals. Source: PitchBook/LCD, data through Sept. 16, 2025
Read More
Chart of the Week: Business Service as Usual
Business services and tech remain strong sectors for LBO candidates. Source: KBRA DLD
Read More
Chart of the Week: Relative Compression
Private credit yields have narrowed since 2023, but less than for single-Bs. Source: KBRA DLD
Read More
Chart of the Week: Tariff Drag
Growth forecasts for this year and next are well below last December’s estimates. Source: Oxford Economics/Haver Analytics
Read More


Subscribe Now!
Join the leading voice of the middle market. Try us free for 30 days.
Click here to view the Newsletter sample.
What is the Lead Left?

- One-stop source for deals and data
- Market trend commentary and analysis
- Exclusive interviews with thought leaders

View Article By
Features
Bloomberg: Leveraged Lending Insights – 10/6/2025


US Leveraged Loans See Busiest Third Quarter on Record Click here to access Bloomberg’s US Leveraged Finance Chartbook September’s US leveraged loan activity totaled 101 deals for $93.2b, representing a $13.6b increase (17.1%) over August’s $79.6b. However, this marked a $4.2b decline compared to September 2024…. Subscribe to Read MoreAlready a member? Log in here...
Middle Market & Private Credit – 10/6/2025


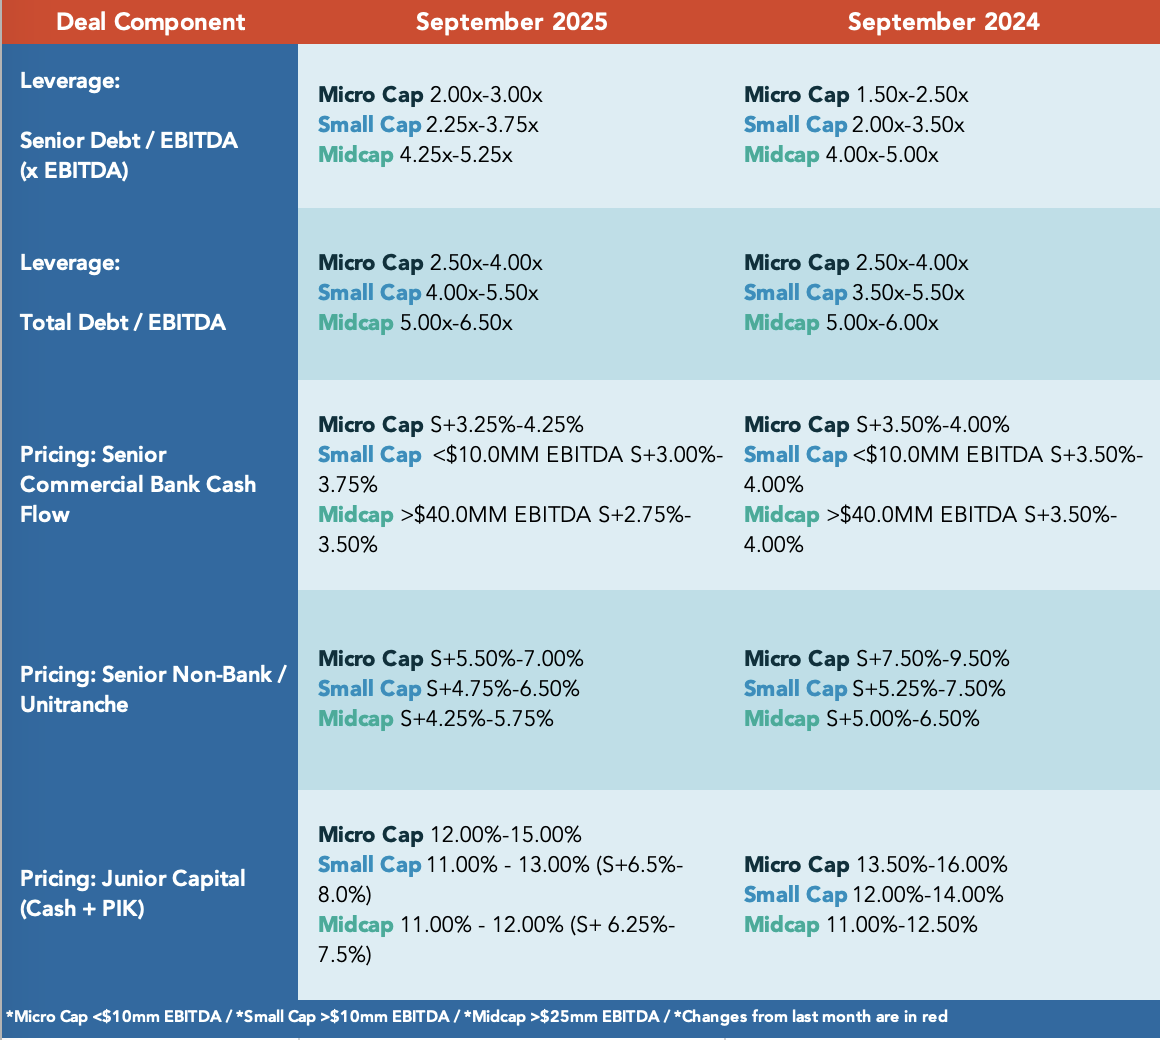
U.S. Private Credit: Sizing Up Defaults Click here to download report. Issuers generating less than $25 million EBITDA defaulted at more than twice the rate of larger companies over the TTM ending 2Q25…. Subscribe to Read MoreAlready a member? Log in here...
The Pulse of Private Equity – 10/6/2025


Share of BSL-financed LBO count by equity contribution Download PitchBook’s Report here. Since rate hikes began in 2022, buyouts under $1 billion have virtually disappeared from the BSL market…. Subscribe to Read MoreAlready a member? Log in here...
Leveraged Loan Insight & Analysis – 10/6/2025


3Q25 LBO volume down over 34% year over year; Total sponsored volume up nearly 39% US lenders committed almost US$20bn in LBO loan volume in 3Q25, up modestly compared to 2Q25 results (which came in at just under US$13bn) but down 34% year-on-year…. Subscribe to Read MoreAlready a member? Log in here...
PDI Picks – 10/6/2025


Fundraising puts on a surge in Q3 The Liberation Day announcement put the brakes on capital accumulation in Q2, but it’s come roaring back. Having looked on course for an average year of fundraising at the halfway mark, private debt managers are now on target to have their most fruitful 12 months of the last…
Middle Market Deal Terms at a Glance
provided by
![]()
Beginning in July 2022 The Lead Left published a series of articles on credit market. This report consolidates those articles.
Cov-lite trends Inflation & rising interest rates – LIBOR to SOFR transition Mega-tranche uni trend ESG takes center stage Login to view interactive report and download PDF version. … Subscribe to Read MoreAlready a member? Log in here Related posts: 2H 2021 Midyear Outlook Report State of the Capital Markets – Fourth Quarter 2016 Review and

Beginning in September 2021 The Lead Left published a series of articles on supply chain. This report consolidates those articles.
Our Content Partners