We conclude our series on the Private Equity liquidity crunch with this question: What do scarce realizations mean for LPs constructing a portfolio in today’s environment? Having reviewed tactical tools and strategies available to investors to find liquidity, deploy capital, and select managers, we turn to building a sound and profitable portfolio.
Every limited partner is unique, but they have commonalities when it comes to assembling a long-term PE portfolio for the long-term. Consistency, balance, and matched goals and outcomes are always important. But what happens to that portfolio in a capital-constrained world with depleted cash in-flows?
✒︎ From the Editor: The Lead Left will be on break until the week of January 6th. To all of our readers, best wishes for a safe, healthy and restful holiday season.
“They may go on hold after December.” – Brian Levitt, global market strategist, Invesco.
Featuring Charts

Chart of the Week: Interest Bearing Accounts
After three flat-to-down years, LP’s look to be gearing up for 2025. Source: Private Equity International’s LP Perspectives 2025 Study
Read More
Chart of the Week: To Co-Invest, or Not to Co-Invest
The majority of GPs in Europe and North America offer equity co-investment programs. Source: Dechert’s 2025 Global Private Equity Outlook. (Past performance is no guarantee of future results.)
Read More
Chart of the Week: Bigger Brothers
Since 2020 the share of GPs raising larger funds has been growing. Source: PitchBook(Past performance is no guarantee of future results.)
Read More
Chart of the Week: No Money-Back Guarantee
The absence of realizations has hampered distributions to LPs. Source: Burgiss/MSCI(Past performance is no guarantee of future results.)
Read More
Chart of the Week: Secondaries on the March
The growth of equity secondaries is fueled by both LP and GP liquidity needs. Source: Jefferies(Past performance is no guarantee of future results.)
Read More
Chart of the Week: On Holds
In the absence of M&A activity, PE portfolio companies are held for extended periods. Source: PitchBook(Past performance is no guarantee of future results.)
Read More


Subscribe Now!
Join the leading voice of the middle market. Try us free for 30 days.
Click here to view the Newsletter sample.
What is the Lead Left?

- One-stop source for deals and data
- Market trend commentary and analysis
- Exclusive interviews with thought leaders

View Article By
Features
Private Debt Intelligence – 12/16/2024

Top ten private debt funds hoover up 60% of capital in 2024 Read more in ‘Preqin 2025 Global Report: Private Debt’ The trend of capital consolidation in private capital continues unabated, with emerging managers finding it increasingly hard to raise funds as the vehicles raised by the most-well known and largest managers have drawn in…
Middle Market & Private Credit – 12/16/2024


NAIC Report Puts Smaller CRA Ratings Under the Spotlight Click here to learn more. At end-2023, US insurers held about USD350 billion of privately rated securities. The NAIC has adopted a proposal to contest private ratings from CRAs if their ratings are three notches higher than an assessment from the NAIC’s Securities Valuation Office (SVO)….
The Pulse of Private Equity – 12/16/2024


Oil & gas fundraising activity Download PitchBook’s Report here. Of the six oil & gas funds to close through Q3, three funds raised over $500 million. The largest fund, Carnelian Energy Capital V, raised $975 million, followed closely by EnCap Flatrock Midstream Fund V on $931 million, though this was well below its $3 billion target…
Leveraged Loan Insight & Analysis – 12/16/2024


CLOs ramp to new heights in ’24, new issuance tops US$186bn thanks to bustling November US CLO new issuance totaled US$25.2bn across 54 vehicles in November, marking the busiest month of the year and the second highest monthly tally on record for the asset class…. Subscribe to Read MoreAlready a member? Log in here...
PDI Picks – 12/16/2024


Private debt’s emerging manager problem New GPs face a tough task to attract investor interest, but there are ways of maximising prospects. It feels somewhat Scrooge-like to point it out at this time of year but, for emerging managers, goodwill appears to be in short supply. In our LP Perspectives study – to be published…
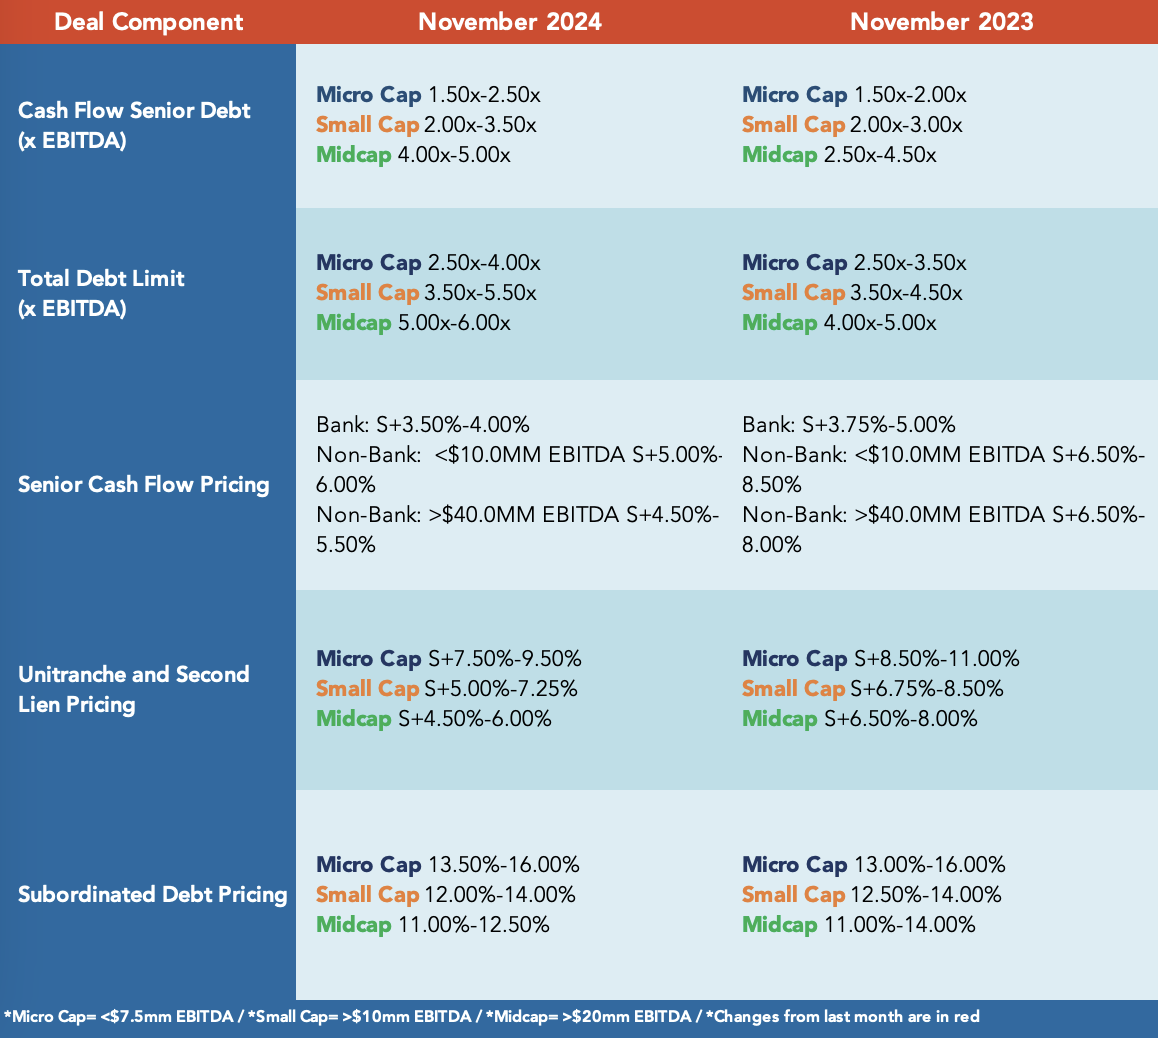
Middle Market Deal Terms at a Glance
provided by
![]()
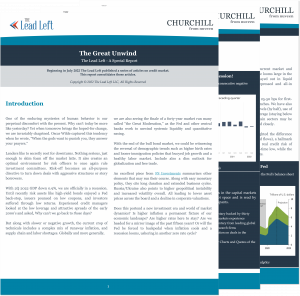
Beginning in July 2022 The Lead Left published a series of articles on credit market. This report consolidates those articles.
Cov-lite trends Inflation & rising interest rates – LIBOR to SOFR transition Mega-tranche uni trend ESG takes center stage Login to view interactive report and download PDF version. … Subscribe to Read MoreAlready a member? Log in here Related posts: 2H 2021 Midyear Outlook Report State of the Capital Markets – Fourth Quarter 2016 Review and
Beginning in September 2021 The Lead Left published a series of articles on supply chain. This report consolidates those articles.
Our Content Partners